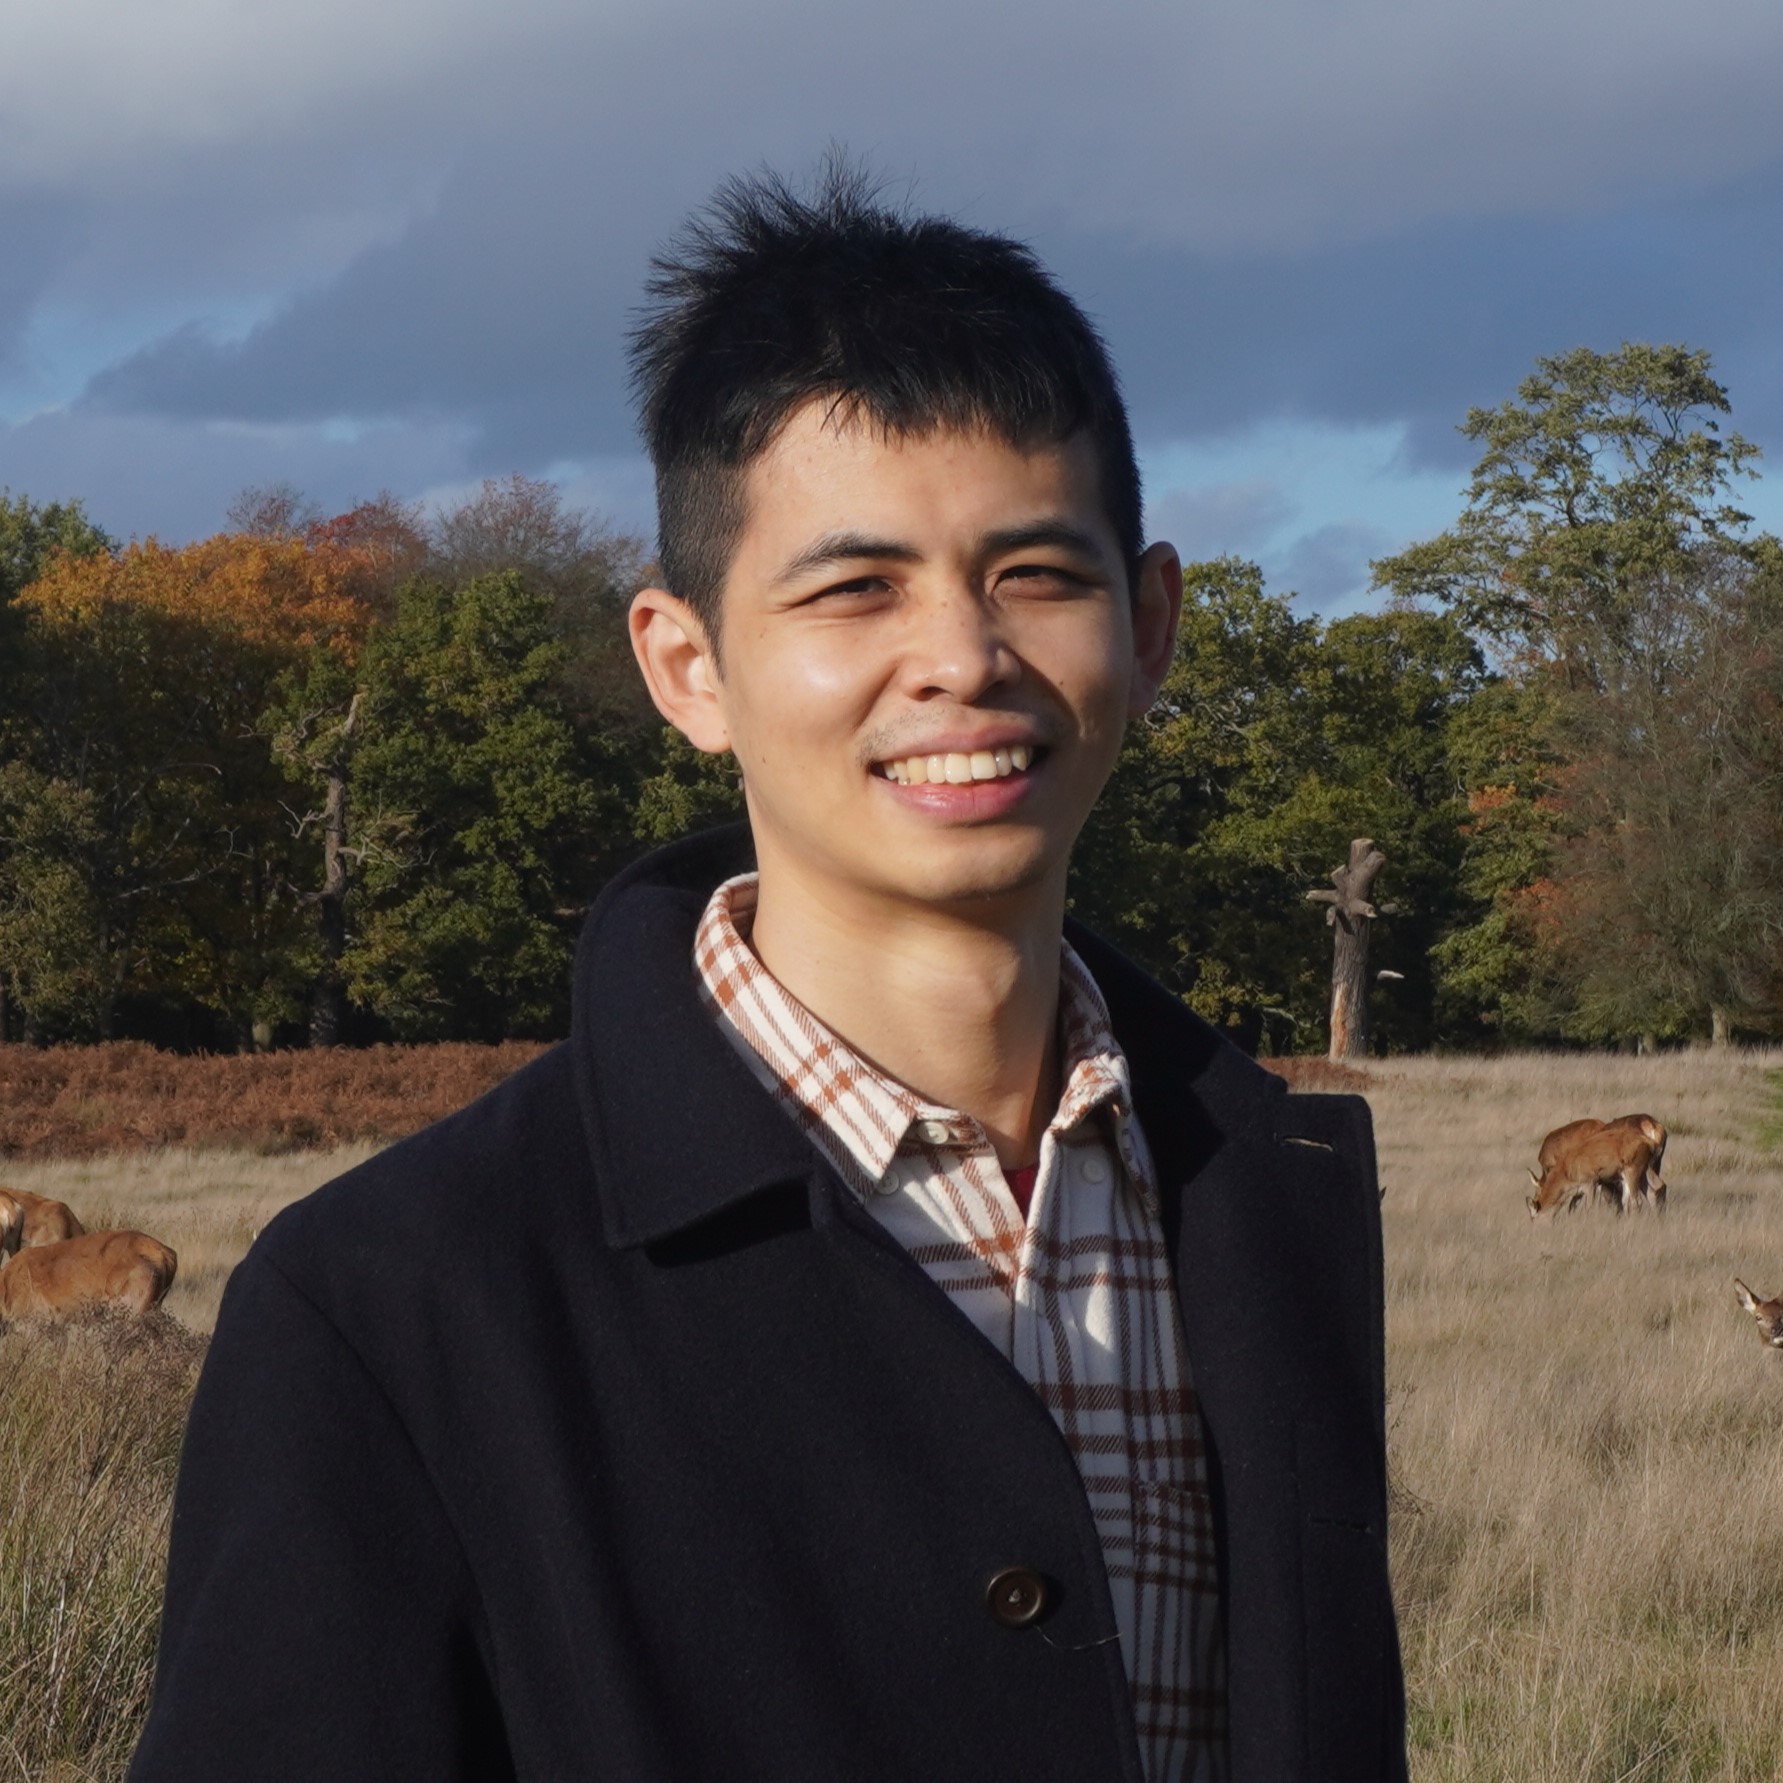
My MSc Journey at LSHTM
This post shares my two publications at LSHTM, showcasing my two student roles and achievements:
Student and Digital Content Ambassador Student Liason Officer at the Vaccine Centre Songs That Accompany Our Study In this blog post, I share the diverse music landscape shaped by my MSc Health Data Science classmates from across the globe. This post is also being highlighted on the World Music Day, 21th June 2024, by the LHSTM channel of Instagram and Facebook.
2024-06-13