
This post shares my poster presentation at the Vaccine Hesitancy Course held by the Croucher Foundation in August, 2024, Hong Kong.
- Download the poster here, which is the milestone of my thesis project at LSHTM.

Introduction
- Global incidence of polio has decreased by 99% since 1988.
- Non-polio Acute Flaccid Paralysis (NPAFP) is the key indicator for the sensitivity of polio surveillance.
- While countries with circulating poliovirus consistently report NPAFP rates exceeding the gold-standard indicator*, it is not well-understood what rate should be expected.
- This project aims to identify predictive features and model expected NPAFP rates in support of polio eradication.
Method
- Global Polio Eradication Initiative’s (GPEI) NPAFP data in Afghanistan, Pakistan, and Nigeria are dependent variable.
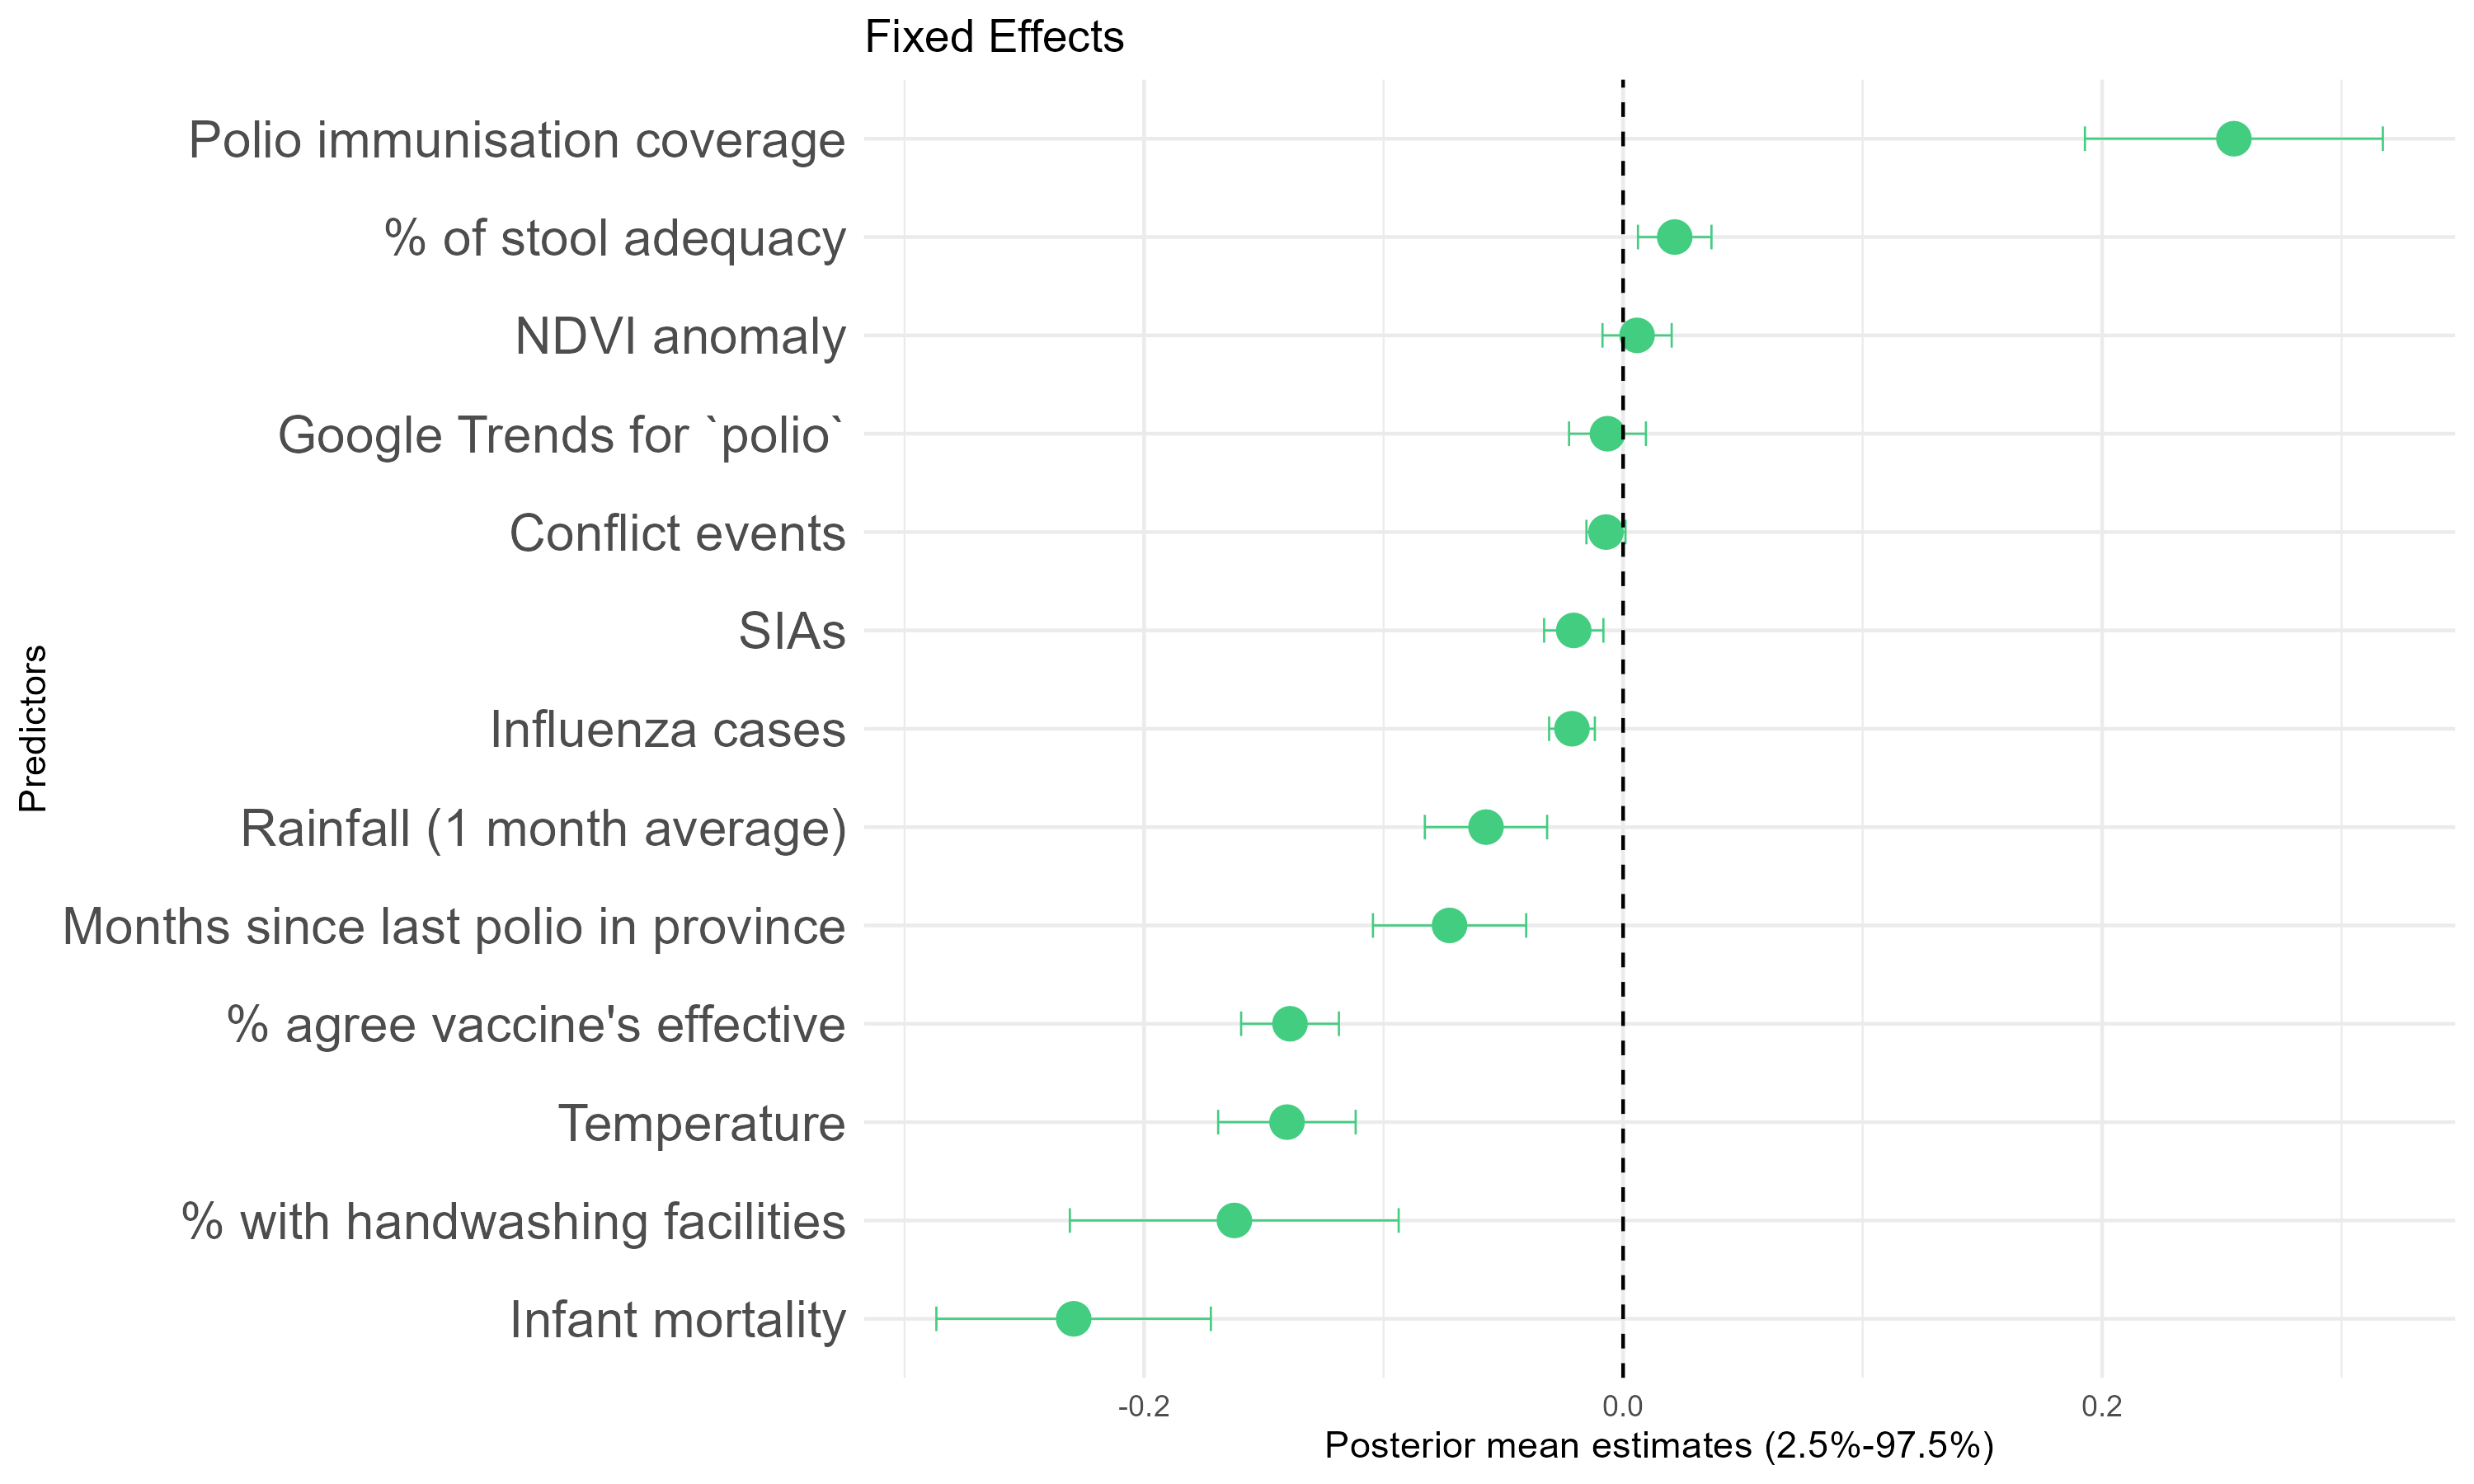
- Predictors are derived from open data, including vaccine confidence index (% agree that vaccines are effective), SIAs (supplementary immunisation activities), and vaccine coverage.
- Integrated nested Laplace approximation (INLA) is used for approximate Bayesian inference. Building on a negative binomial framework, population serves as the model’s offset. Regarding spatial and temporal dependency, Besag-York-Mollié (BYM) and autoregressive models (1) are used, respectively. A penalized complexity (PC) prior on the precision is specified.
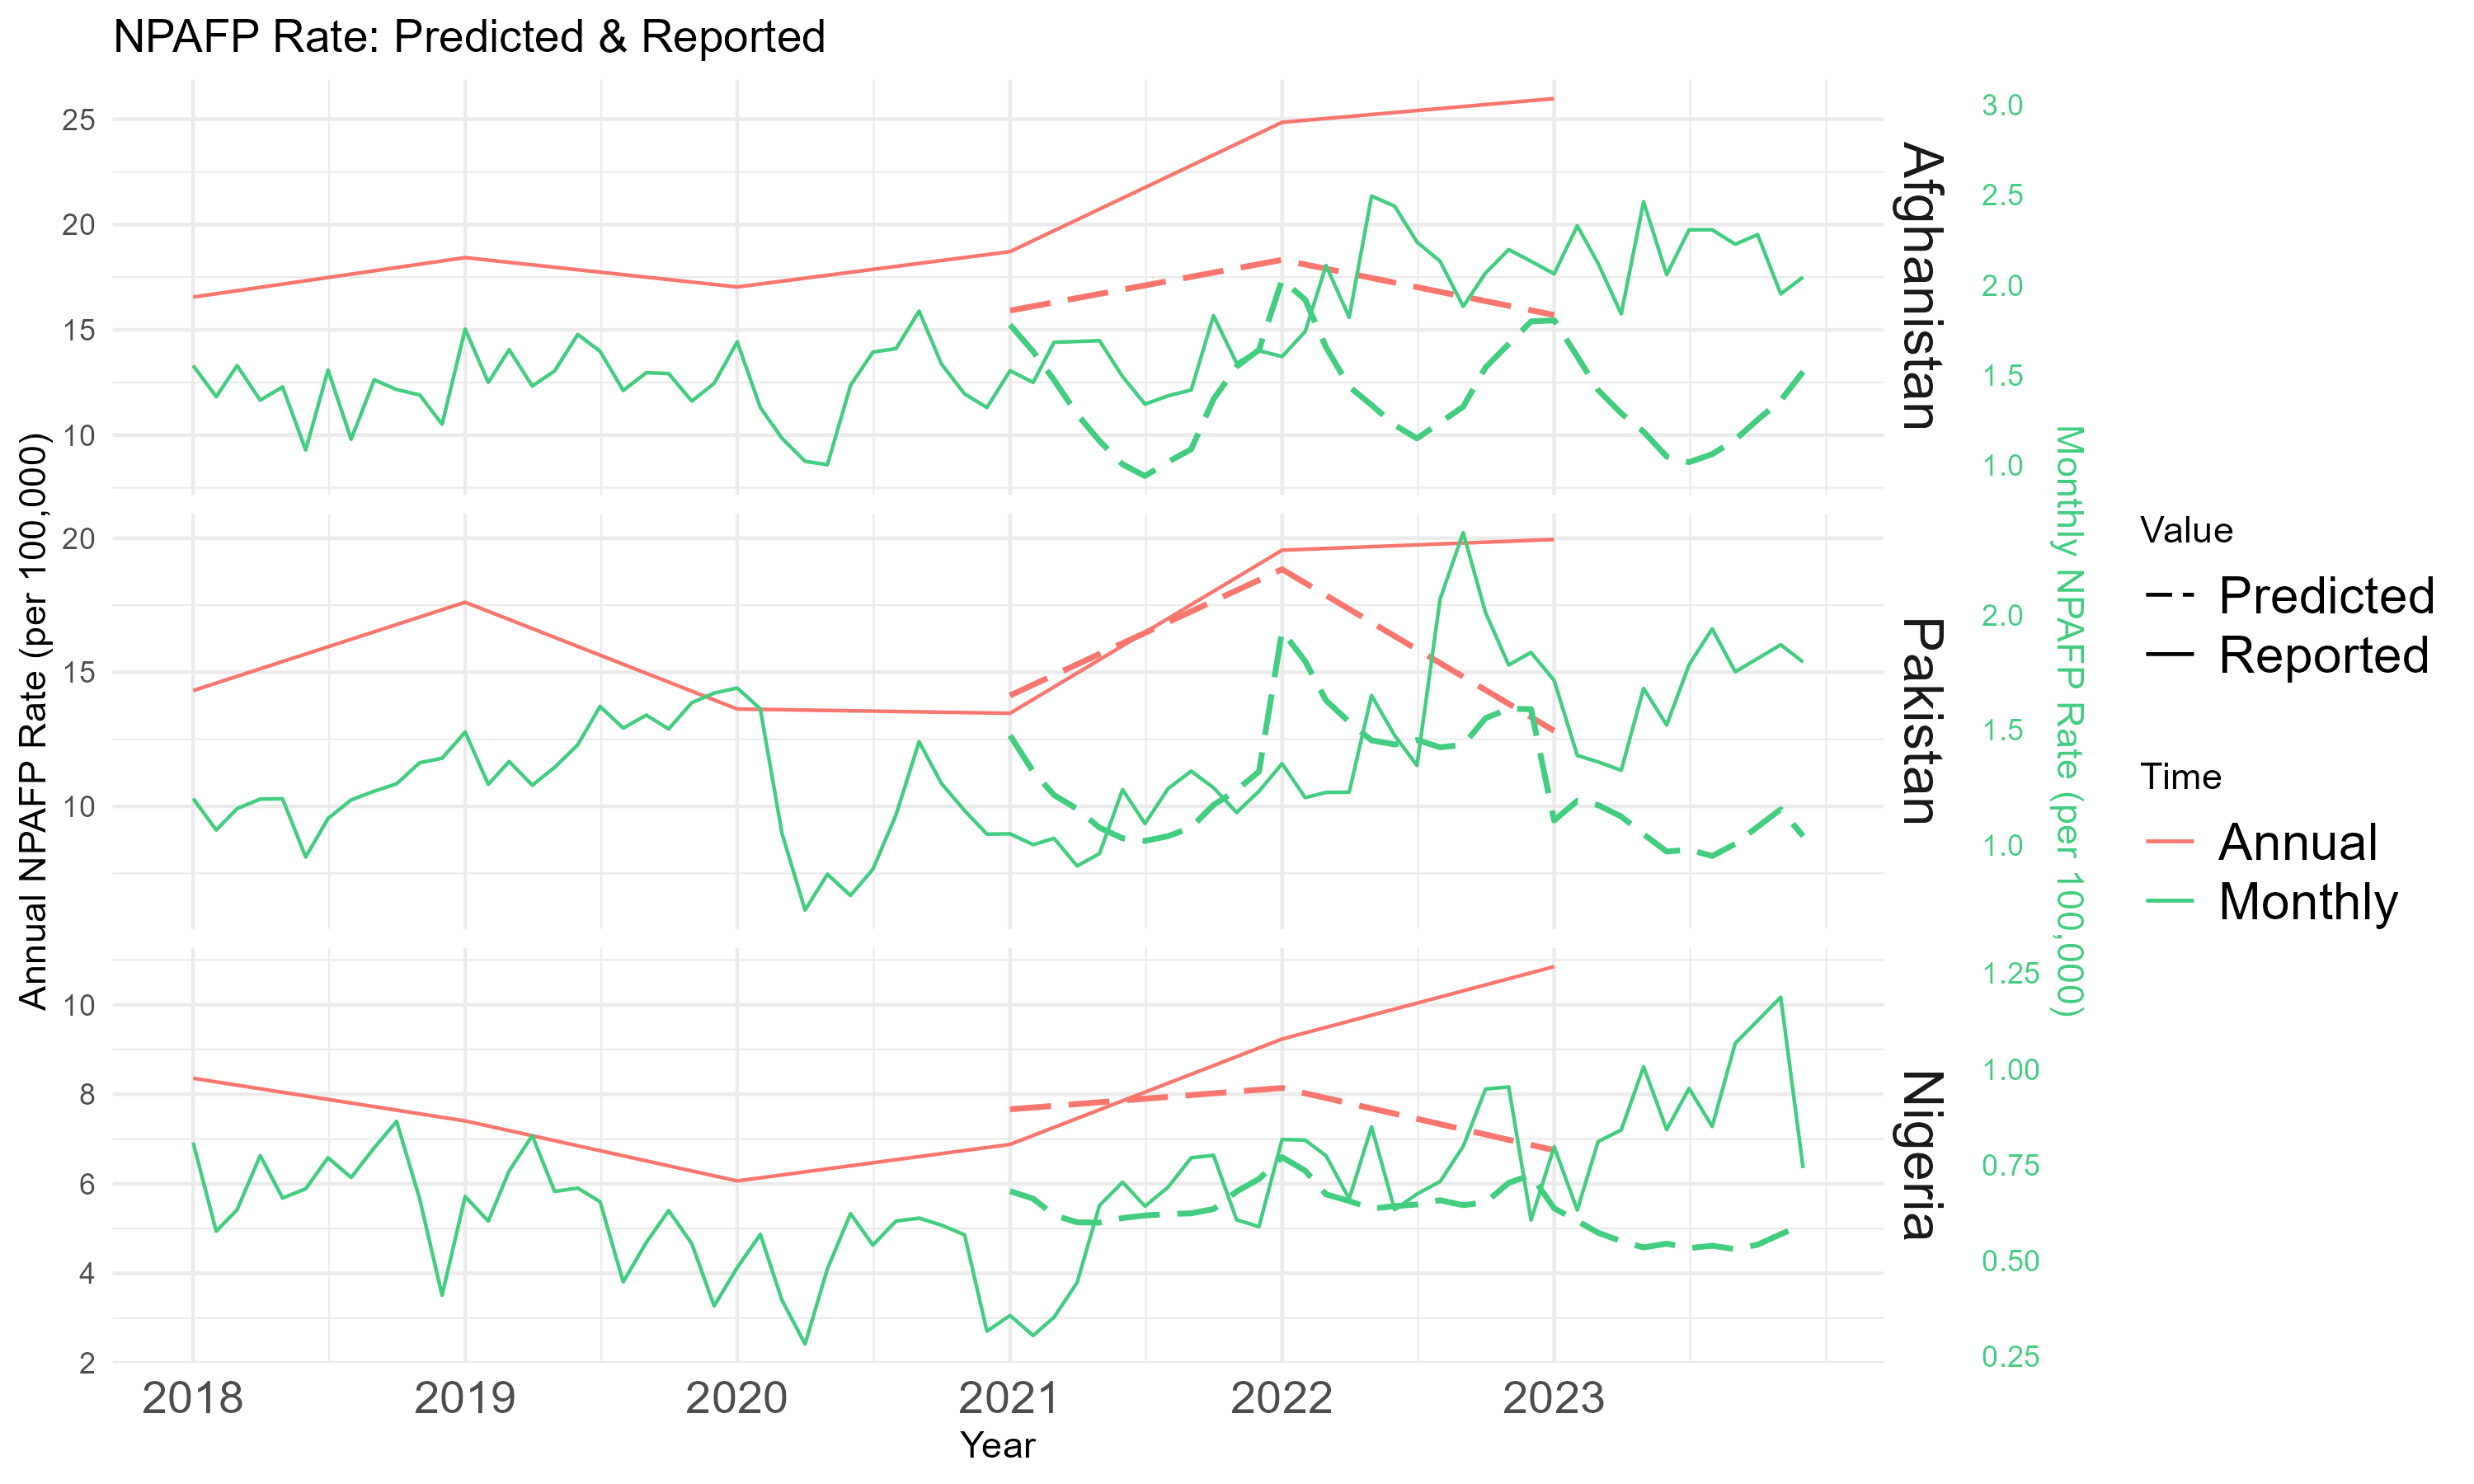
- Monthly aggregated scaled data at admin 2 level from 2018 to 2020 are fitted to predict NPAFP cases between 2021 and 2023.
Result
- In the past 3 years, the observed average annual NPAFP rates were 23 in Afghanistan, 18 in Pakistan, and 9 in Nigeria per 100,000. The predicted rates are 17, 15, and 8, respectively.
- Polio vaccine coverage among 1-year-olds is the strongest positive predictor for NPAFP. SIA and % agree that vaccines are effective have a negative posterior mean for NPAFP.
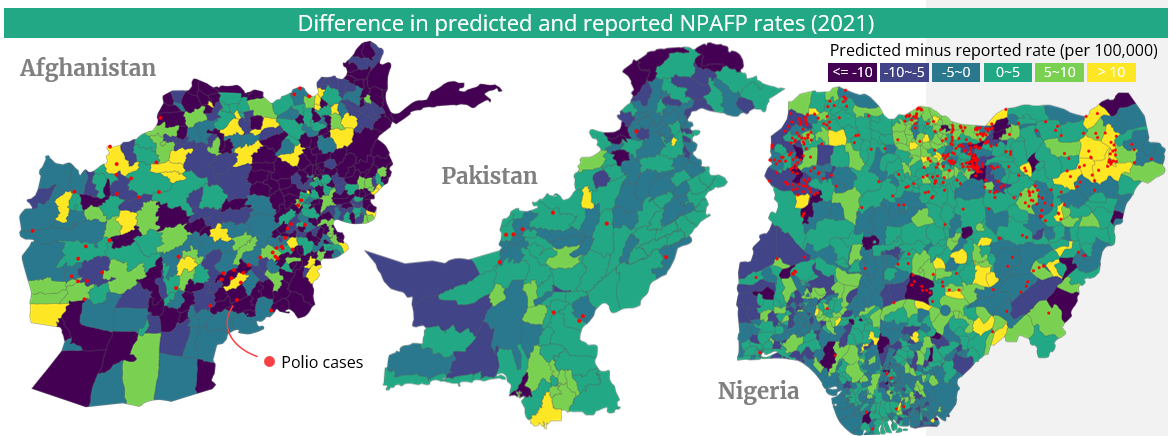
- In 2021, the mean differences of predicted and observed annual NPAFP rates among districts are -7.4, -0.6, 0.7 per 100,000 for Afghanistan, Pakistan, and Nigeria, respectively.
Discussion
- In comparison of predicted and reported NPAFP rates, yellow areas on the maps surrounded by polio confirmed cases (red dots) may indicate at-risk regions with lower sensitivity of the AFP surveillance systems.
- Predictors may provide insights into the NPAFP notification process, covering aetiologies of AFP-causing illness, accessibility & utilization of healthcare services, and reporting practices.
- The polio eradication and certification efforts need to reassess the decade-old “gold-standard indicator”.
- The mechanisms linking vaccine confidence and coverage to AFP reporting requires further investigation.
Conclusion
With both observed and predicted NPAFP rates greatly surpassing the indicator, areas with lower sensitivity of polio surveillance require attention.
I thank the scholarship sponsored by the Croucher Foundation for attending the course, with thanks to Dr Emily Nightingale for her supervision and Prof Edward Parker for writing the recommendation letter for me.