
This post shares a publication on Think Global Health, showcasing collaborative efforts with my teammamtes: Wan-Jen Lee, Giovanni Jacob, Dhihram Tenrisau, and Caitlynne McGaff.
- Read our article by navitagting to Think Global Health.
Data Visualisations
Epicurve in England
 This graph has been recreated by Editor Allison Krugman.
Selected Heatmaps
 Heatmaps showing the log hospitalization rates for influenza and RSV throughout each season. Darker shades means higher hospitalization rate. This graph has been recreated by Editor Allison Krugman.
Pathgraph Overview
Hospitalization Peak in Each Season
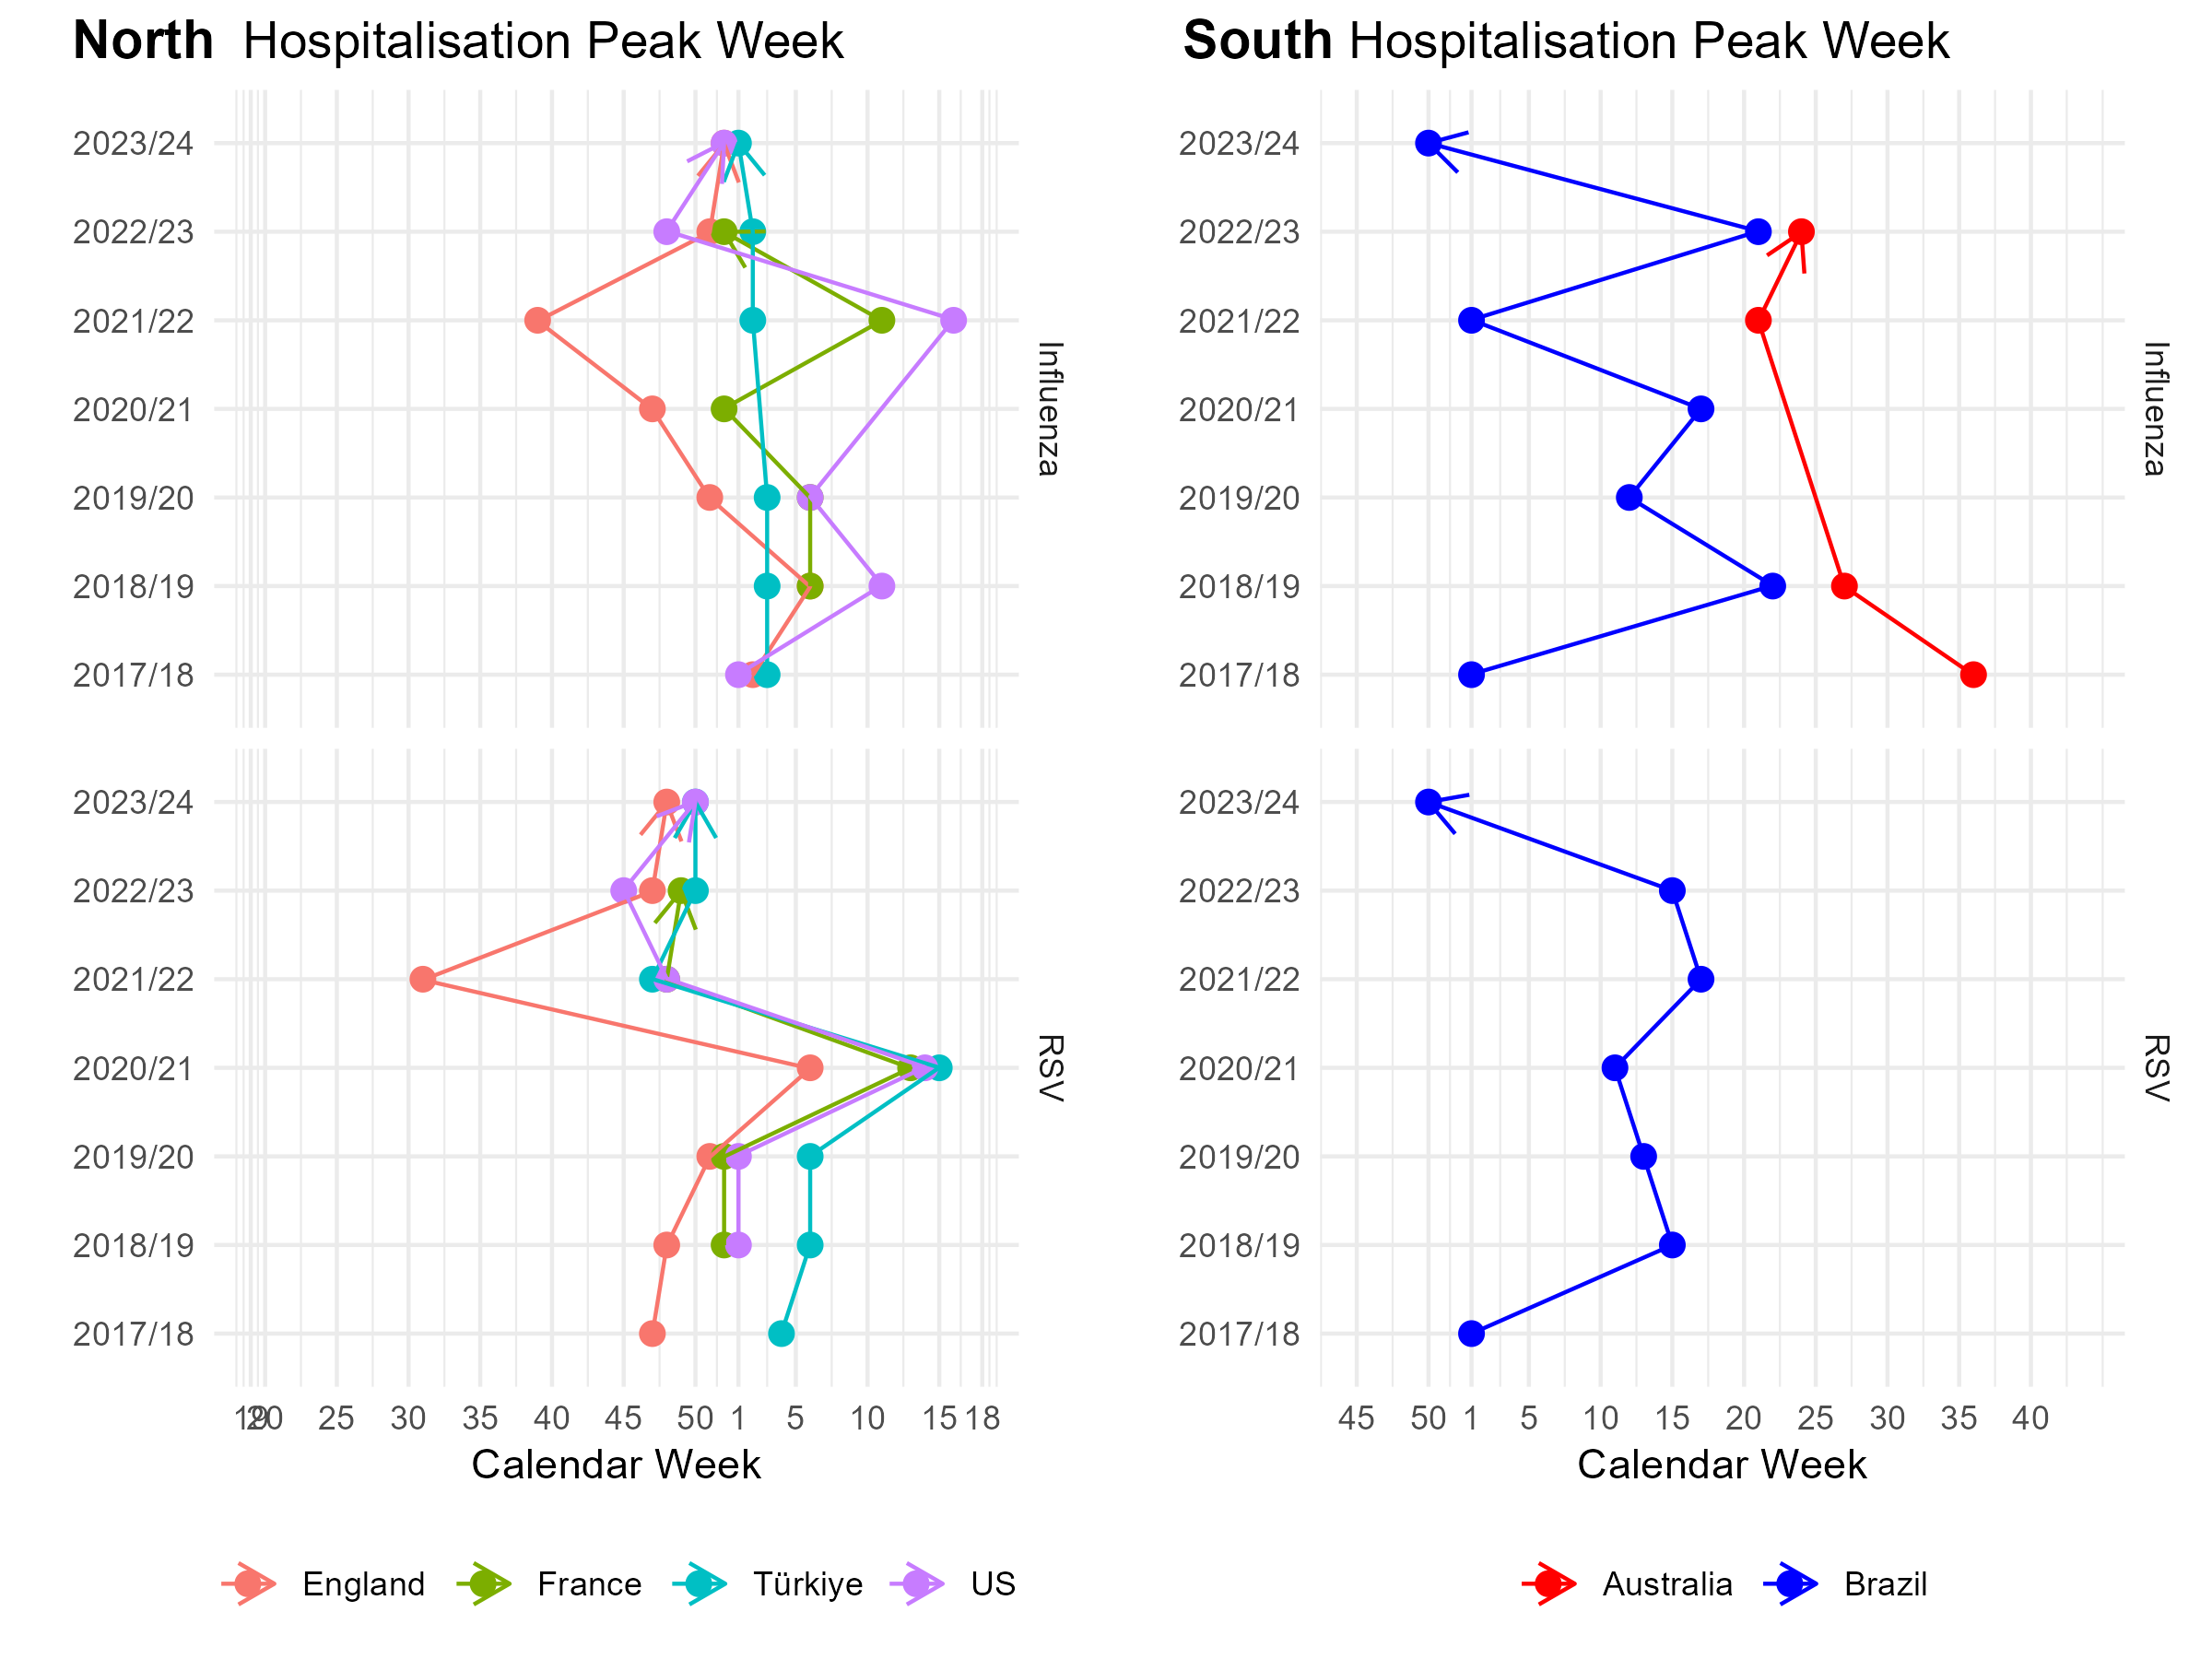 Dot represents the highest hospitalization rate within the season, starting from week 19 for northern hemisphere and week 45 for southern hemisphere. A line indicates the peak trends for each country from the earliest to the latest season.
This graph was created by me, although it wasn’t ultimately included in the publication.
Dot represents the highest hospitalization rate within the season, starting from week 19 for northern hemisphere and week 45 for southern hemisphere. A line indicates the peak trends for each country from the earliest to the latest season.
This graph was created by me, although it wasn’t ultimately included in the publication.
Summary
- The COVID-19 pandemic disrupted the transmission of respiratory pathogens, including influenza (flu) and respiratory syncytial virus (RSV).
- Influenza hospitalisation peaks have been occurring 4.3 weeks earlier in five temperate countries (England, France, Türkiye, US, and Australia) since the 2019-2020 season.
- RSV hospitalisation peaks were more erratic, arriving 1.3 weeks earlier on average in the five temperate countries after the pandemic.
- The WHO may need to consider convening consultations earlier for influenza vaccine composition due to the observed shifts.
- Several factors have potentially influenced the observed shifts, including contact patterns, public health social measures, and immunity (decline in vaccine uptake, changes in vaccination attitudes, and vaccine fatigue).
- Year-round monitoring for multiple pathogens with overlapping symptoms profiles and reporting to global surveillance databases are essential for timely planning and delivery of health protection programs.
Data Source
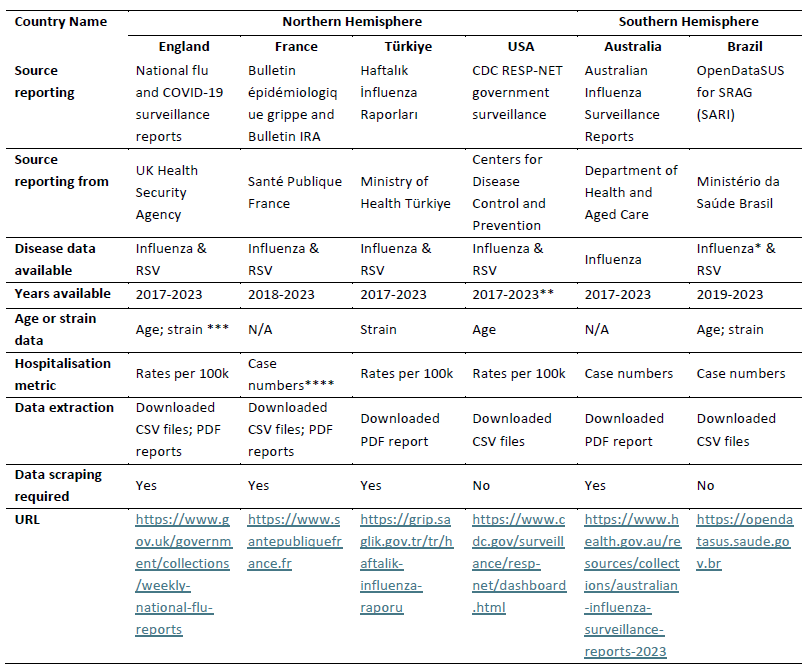
This article is adapted from the assignment of the Data Challenge module at LSHTM. We thank Associate Professor Rosalind Eggo for her expert guidance and thank Associate Professor Thomas Cowling and Assistant Professor Simon Procter for making this possible. Also huge thanks to editors Nsikan Akpan and Allison Krugman.