
In this article, we will explore the following topics:
- Using regularized method (Lasso) for predictive variable selection
- Tuning hyperparameters for tree-based methods
- Employing the weighted sum of weak learners for boosted classifier
- Comparing prediction performances and predictors importance
Basic Methods
Inmagine you possess a dataset comprising 30 biomarker varaibles with 5000+. How would you use it to predict patient’s remission status, i.e. remission or active disease? One common approach that may cross your mind is the logistic regression, as illustrated below:
logit(p) = β0+β1X1+β2X2 +…+β30*X30
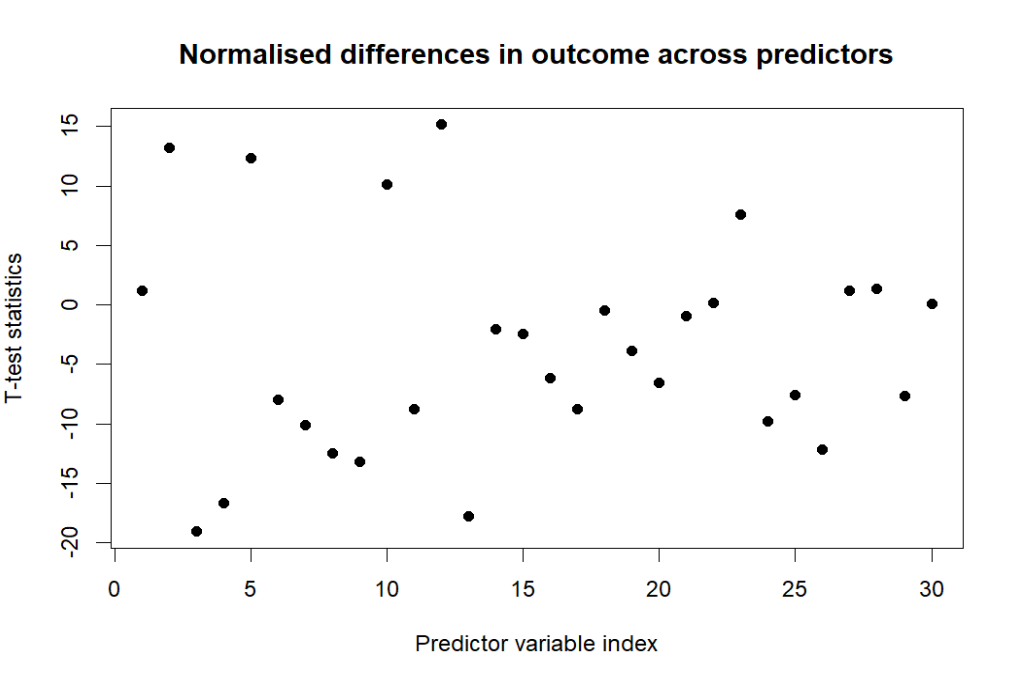
In addition to logistic regression, we can apply t-test to inform the normalised difference between remission’s binary outcome.
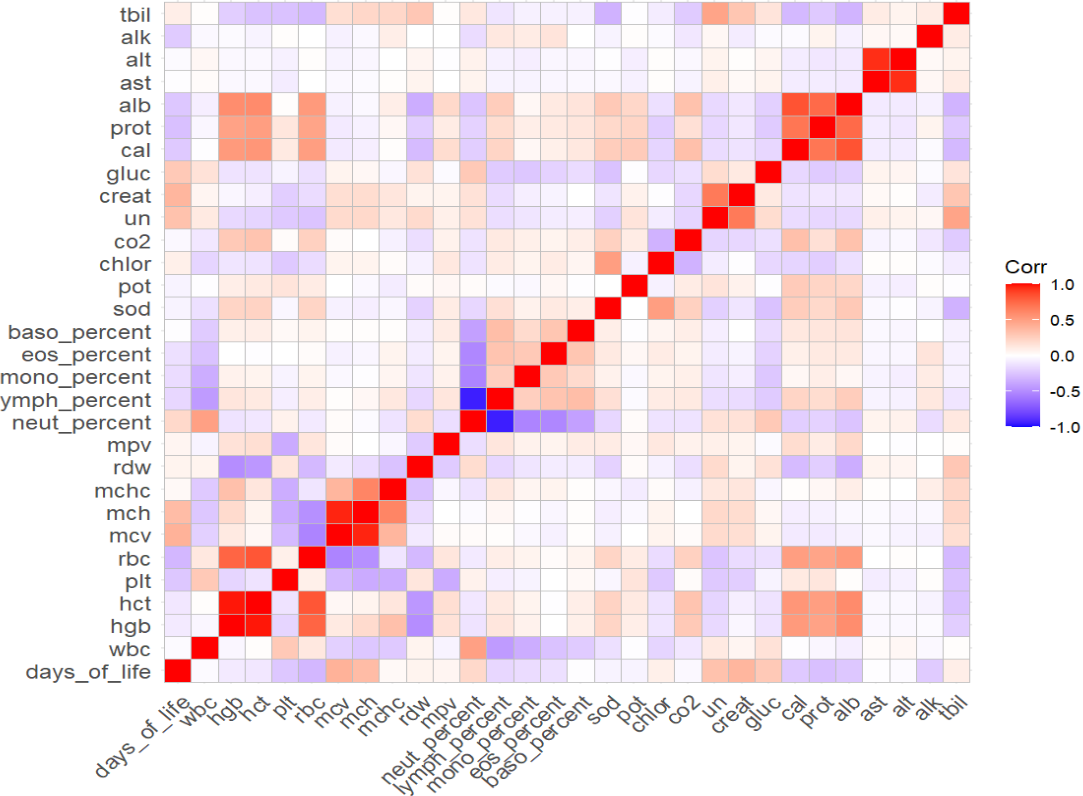
Also, regarding collinearity, it worths looking into the correlations across the predictive variables. Through visual inspection, we can identify some strong correlations, such as alt & ast, ymph_percent * neut_percent in the correlations plot.
Regularized Mothod
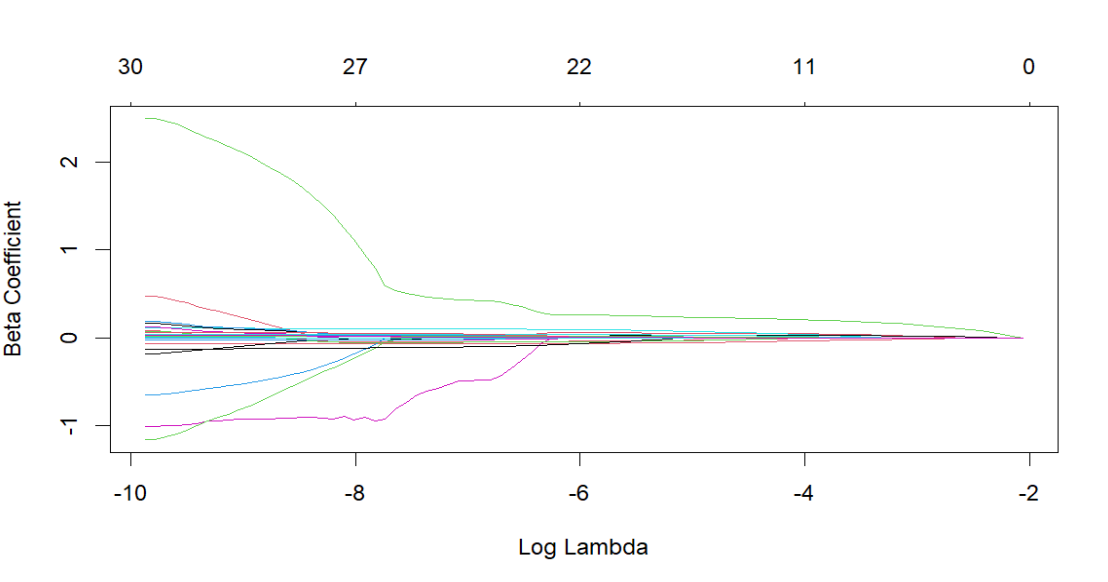
Lasso regression is a regularized method in machin learning that performs both variable selection and regularization. It can identify the insignificant or unimportant variables as zero coefficients. The variable selection and shrinkage effect are strong with the penalty parameter λ. With the increase of λ in the below, the number of non-zero coefficients reduces from 30 to 0, where the lines are shrinkage paths.
To find an optimal hyperparameter λ, I used an automated 10-fold cross validation on Lasso. The lowest error is observed at the log λ of -8.11. However, I want to choose the λ at which error is within 1 standard error of the minimal error, i.e. the 1 se criterion. To balance the bias-variance trade-offs, log λ of -4.66 is preferred because it provides similar predictive performance compared to log λ of -8.11. This is also much easier to interpret with less variables, and less likely to overfit to noise in the training data.
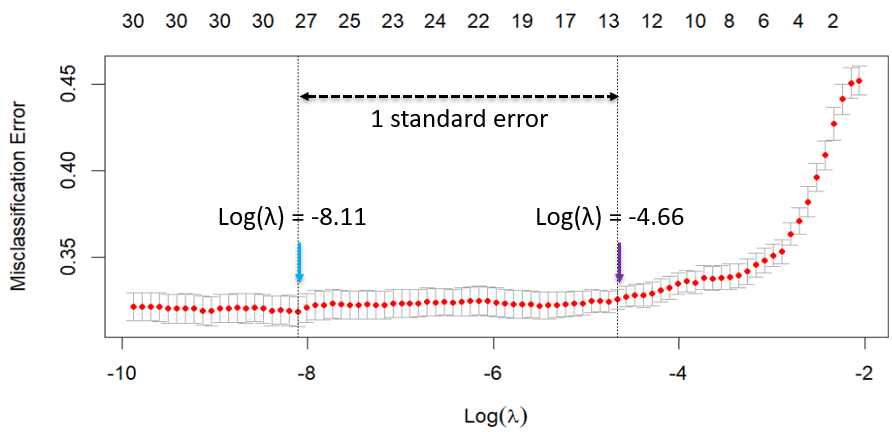
After tuning the λ, there are 12 no-zero beta coefficients remaining in the Lasso laerner. The complexity of the model is hence reduced.
Tree-based Methods
CART
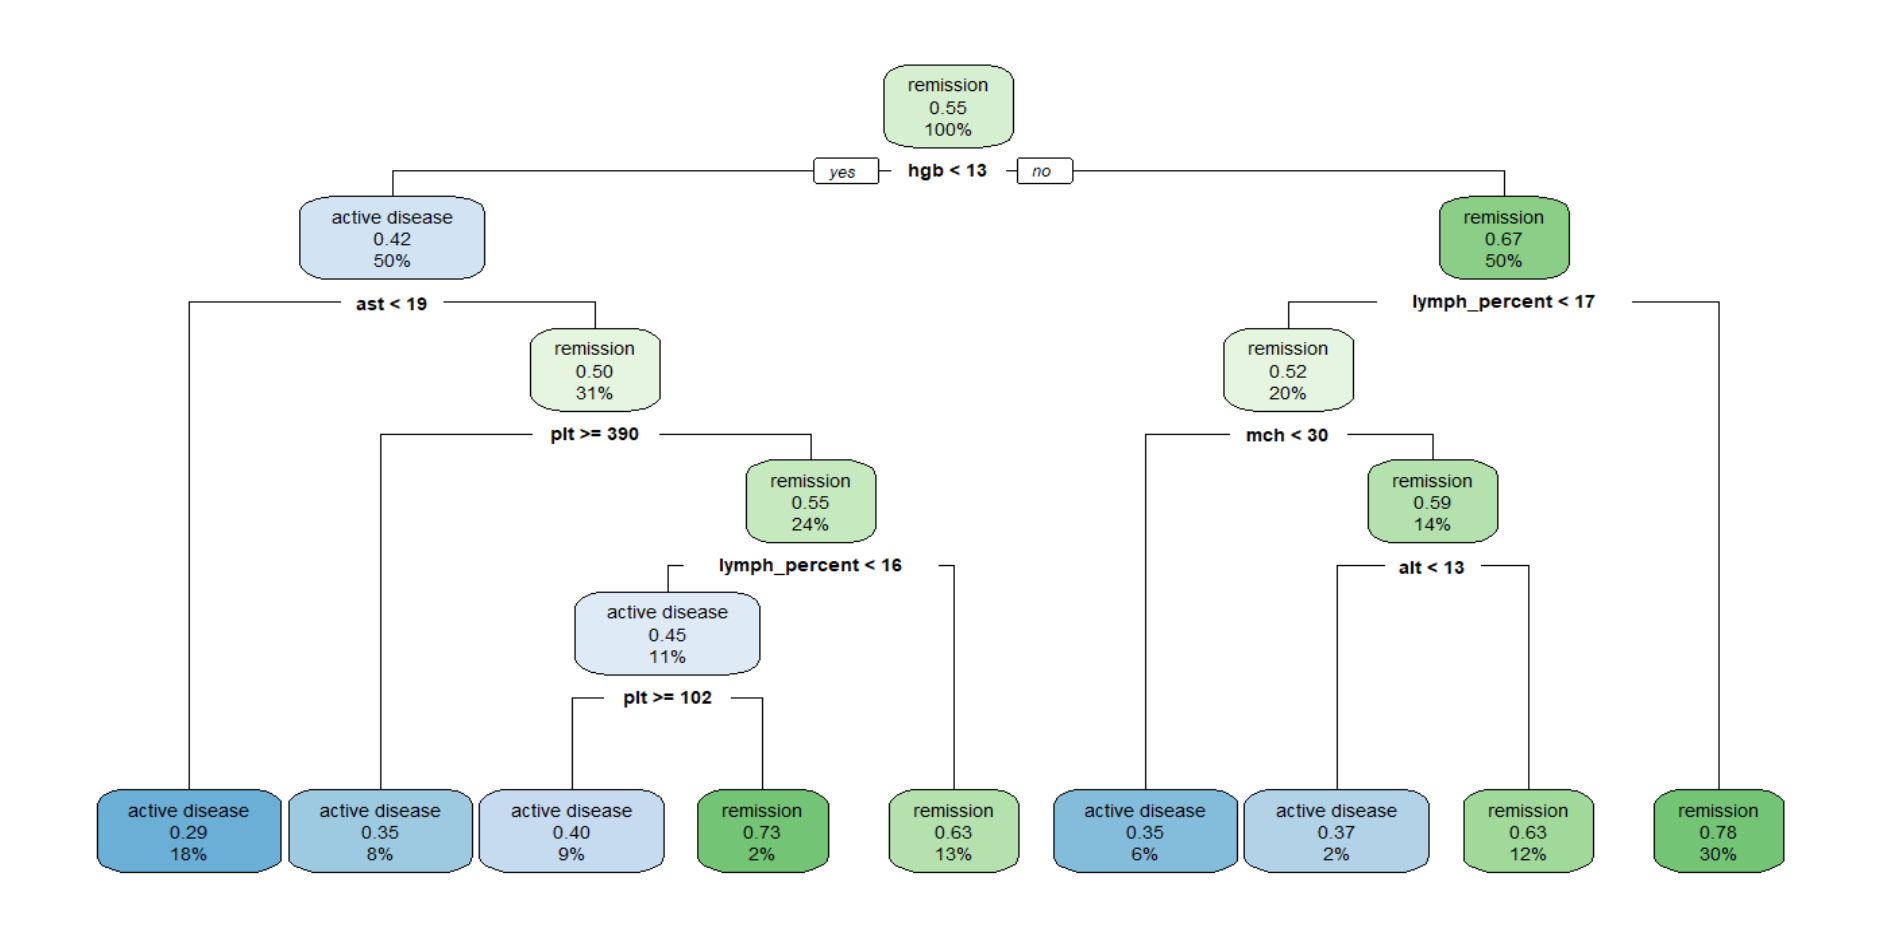
As a supervised learning approach, a single Classification And Regression Trees (CART) is a useful algorithm, which is used as a predictive model to draw conclusions about a set of observations. At each node, the tree grows in a binary direction, initiating the first split based on whether the hgb is less than 13 or not. In the node where hgb < 13, it is calssified that 67% of the patients has a status of remission.
Bagging
With more than one decision trees, our learning model can be become ensemble, which means the kearning process is made up of a set of classifiers. The bootstrap aggregation, also known as bagging, is the most well-known ensemble method. Using bagging, a random sample of data in the training set is selected with replacement and then trained independently. Finally, taking the average or majority of those estimates yield a more accurate prediction.
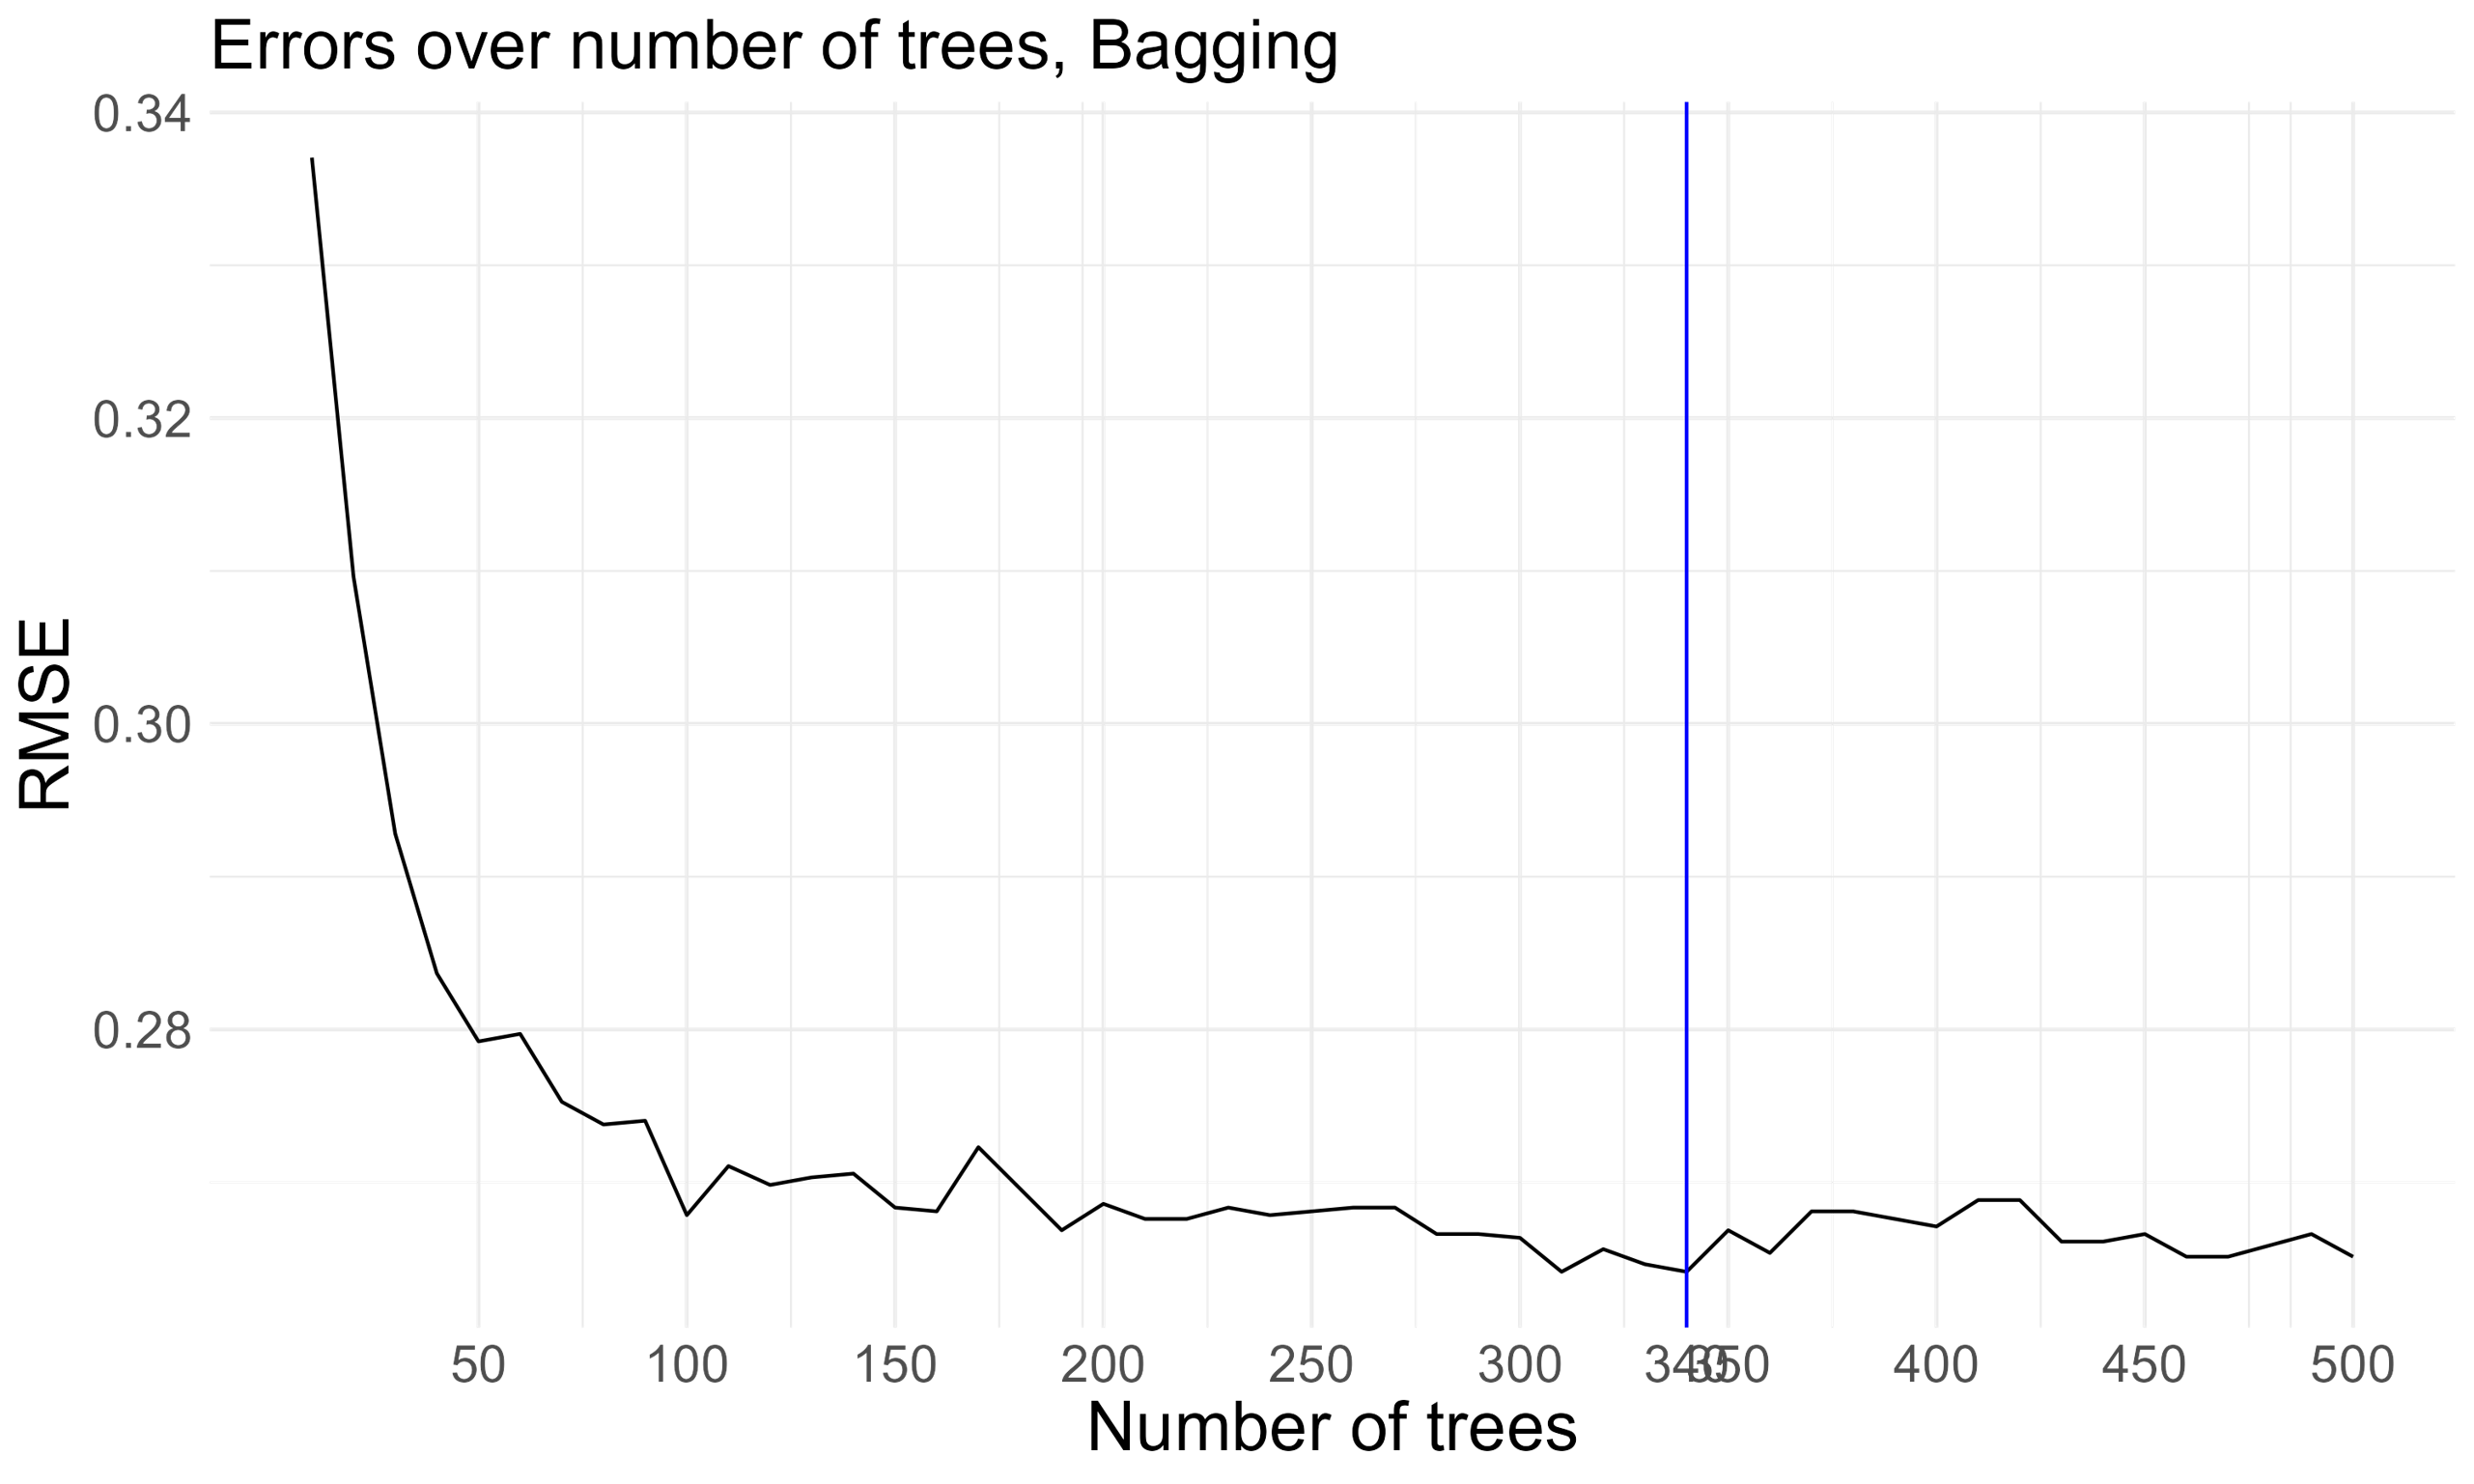
In our training data, I loop over 10 to 500 trees for bagging. This help me to determine the number of trees required to sufficiently stabilize the Root Mean Squared Error (RMSE). With 340 trees, the model achieves the lowest RMSE and demonstrates a tendency to stabilize thereafter.
Random forest
Random forest algorithm is an extension of bagging, as it uses both bagging and feature randomness to create an uncorrelated forest of decision trees. In random forest, a selection of a subset of features ensures low correlation among decision trees, which can reduce over fitting and increase accuracy.
To training a random forest algorithm, five hyperparameters should be considered:
- Splitting rule
- Maximum tree depth/ Minimum node size
- Number of trees in the forest
- Sampling fraction
- Number of predictors to consider at any given split (mtry)
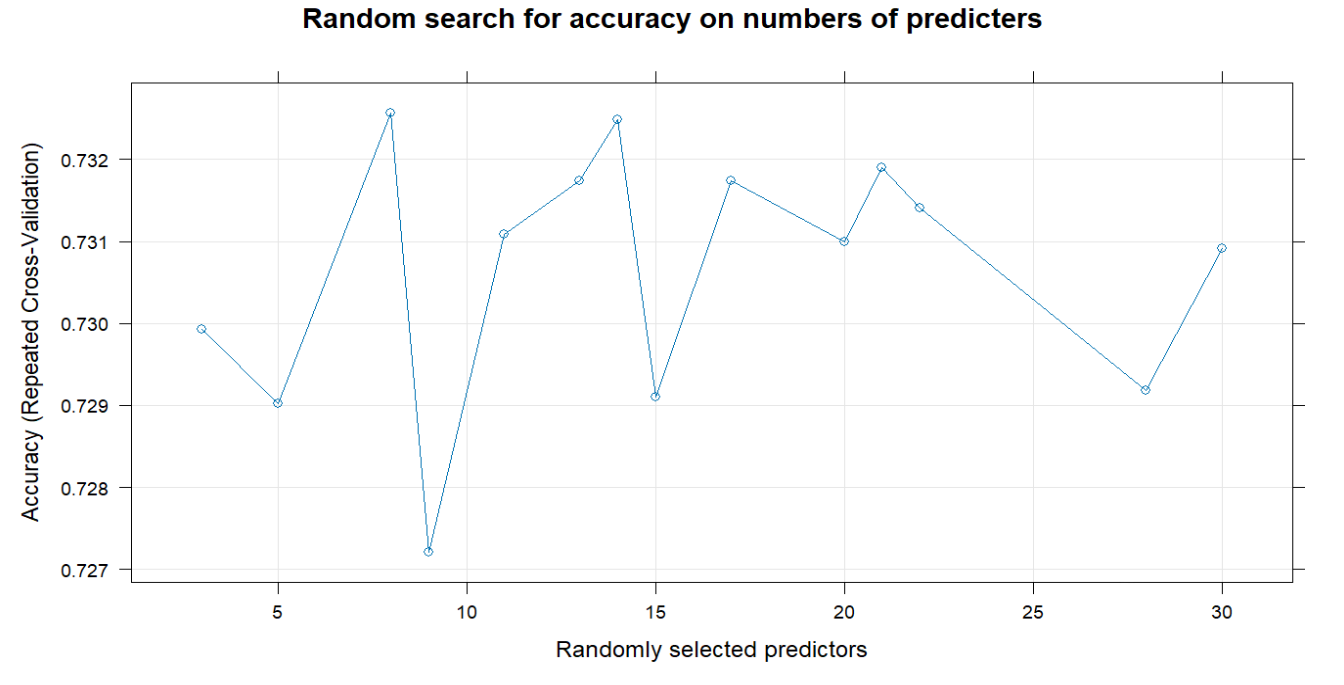
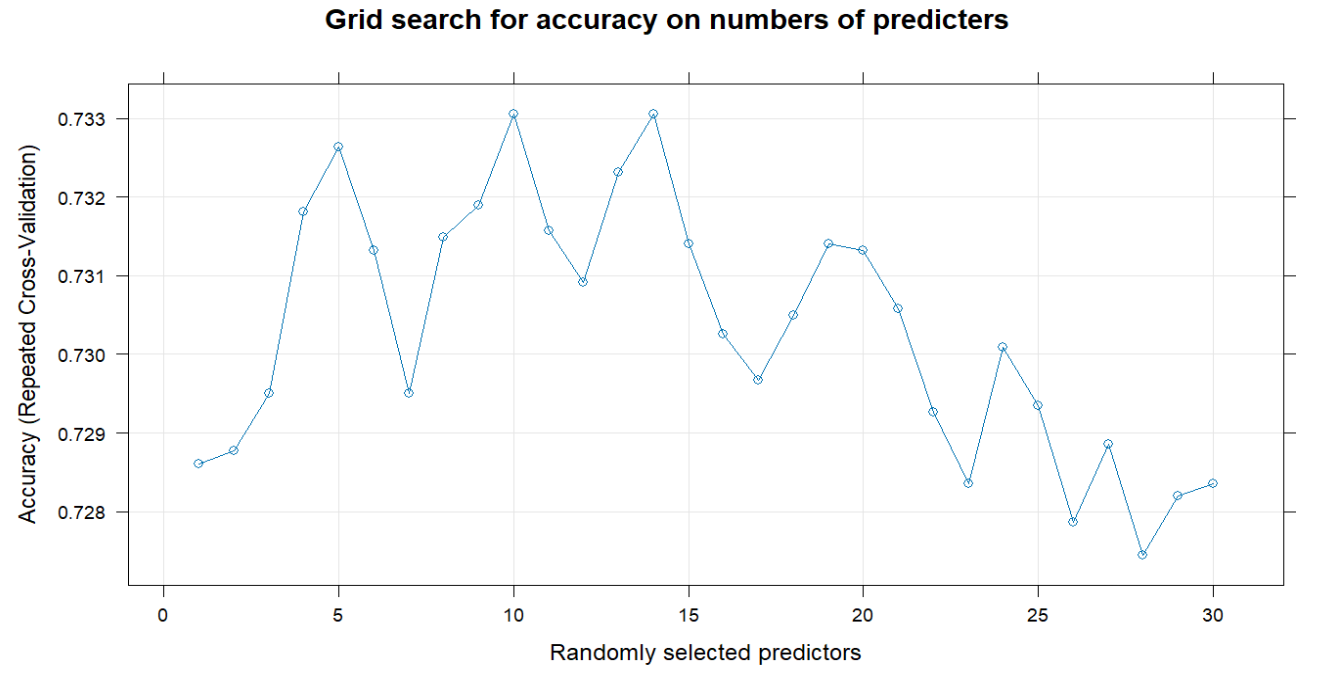
To find an optimal mtry, here I utilize 10-fold cross validation for random search and grid search. In random search, when you have 8 predictors to consider at any given split, you have the highest accuracy. In grid search, the optimal mtry is 10, with a higher Kappa, indicating a better classifier, considering the marginal distribution of the remission status.
With regard to sampling fraction, reducing the sample size can help minimize between-tree correlation. As different sets of sampling fractions are tried, either with or without sampling replacement, the minimal out-of-bag (OOB) RMSE is observed at 90%. This suggests that optimizing predictions can be achieved by drawing 90% of observations for the training of each tree.
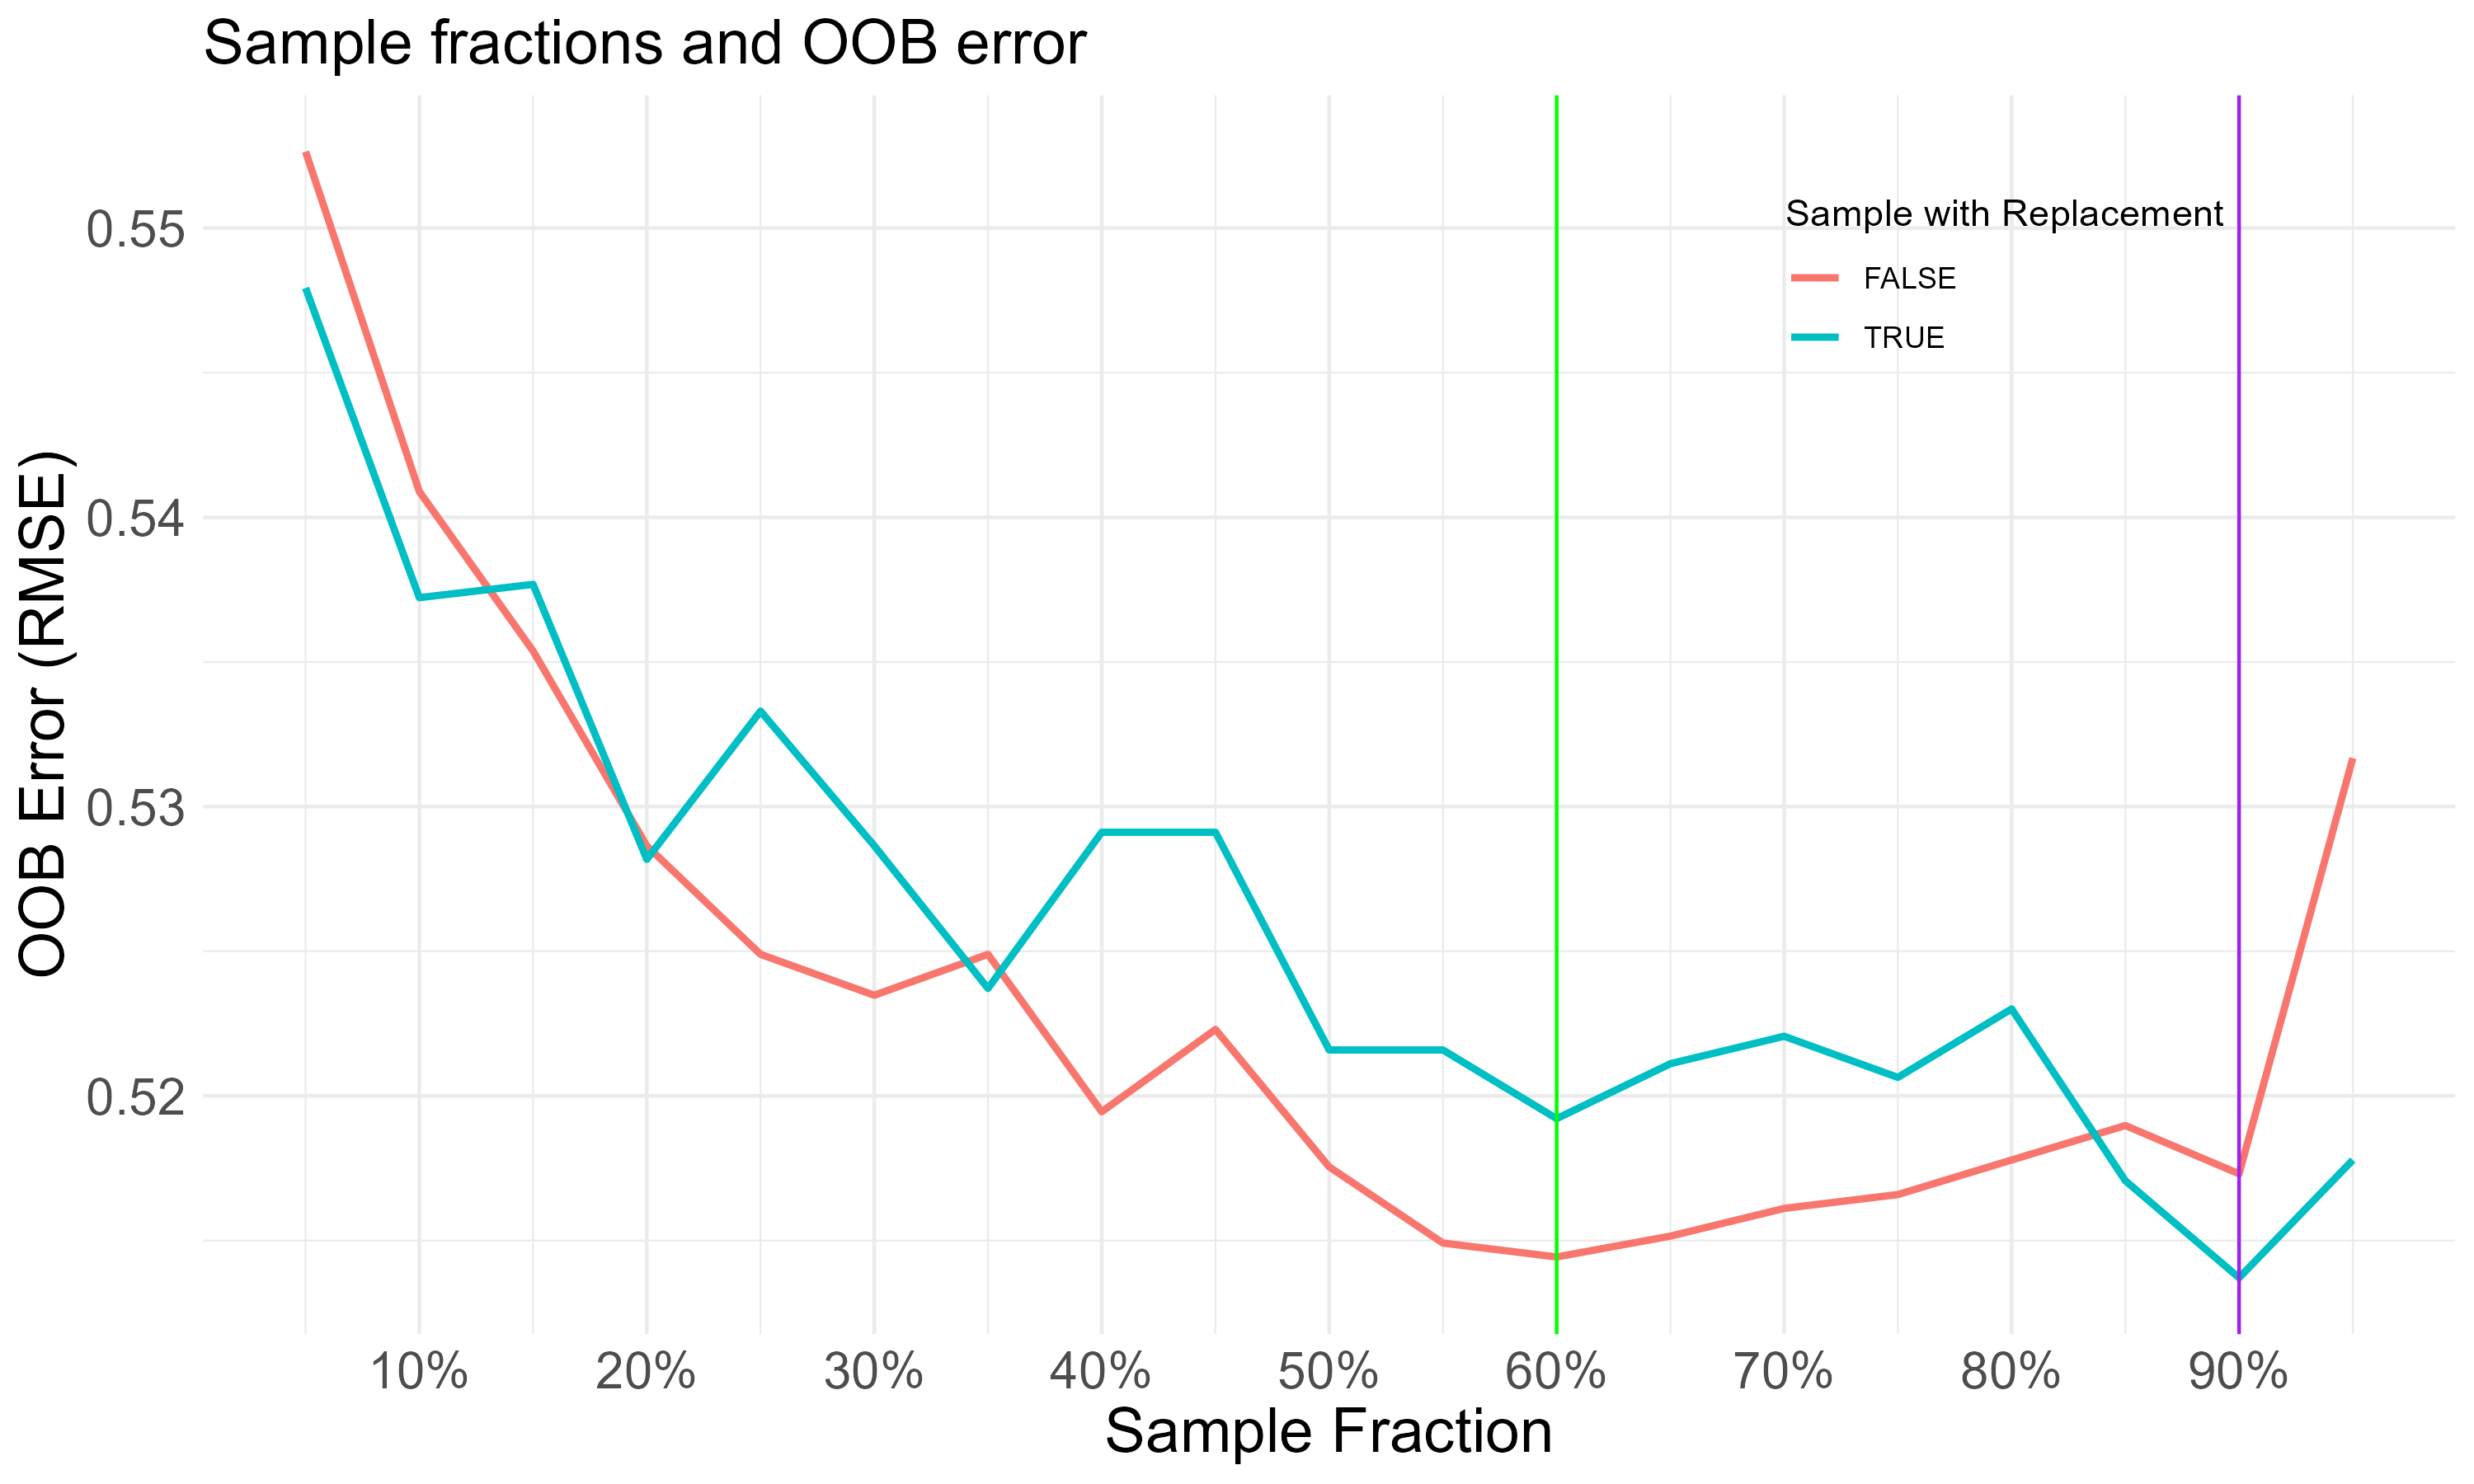
Going through these searches of hyperparameters with minimal OOB RMSE, the tuned random forest requires at least 340 trees to grow, with 10 mtry and 90% sampling fraction (with replacement). Gini impurity is adopted for the split rule, which is suitable for the scope of classification.
| mtry | 10 | 10 | 8 | 8 |
|---|---|---|---|---|
| Sampling fraction | OOB RMSE (replacement) | OOB RMSE (non-replacement) | OOB RMSE (replacement) | OOB RMSE (non-replacement) |
| 100% | 0.5175449 | 0.5165891 | 0.5139516 | 0.5237148 |
| 90% | 0.5137112 | 0.5173061 | 0.5165891 | 0.5194512 |
| 60% | 0.5192133 | 0.5144322 | 0.5192133 | 0.5170672 |
Overall, in evaluating prediction performance, it is evident that the tuned random forest exhibits the lowest RMSEs among the tree-based methods.
| Learner | OOB misclassification error | RMSE (validation set) |
|---|---|---|
| Single CART | - | 0.58809 |
| 340 bagged trees | 0.2641463 | 0.5058941 |
| Random forest (default) | 0.2661 | 0.5049165 |
| Random forest (tuned) | 0.2639 | 0.5058941 |
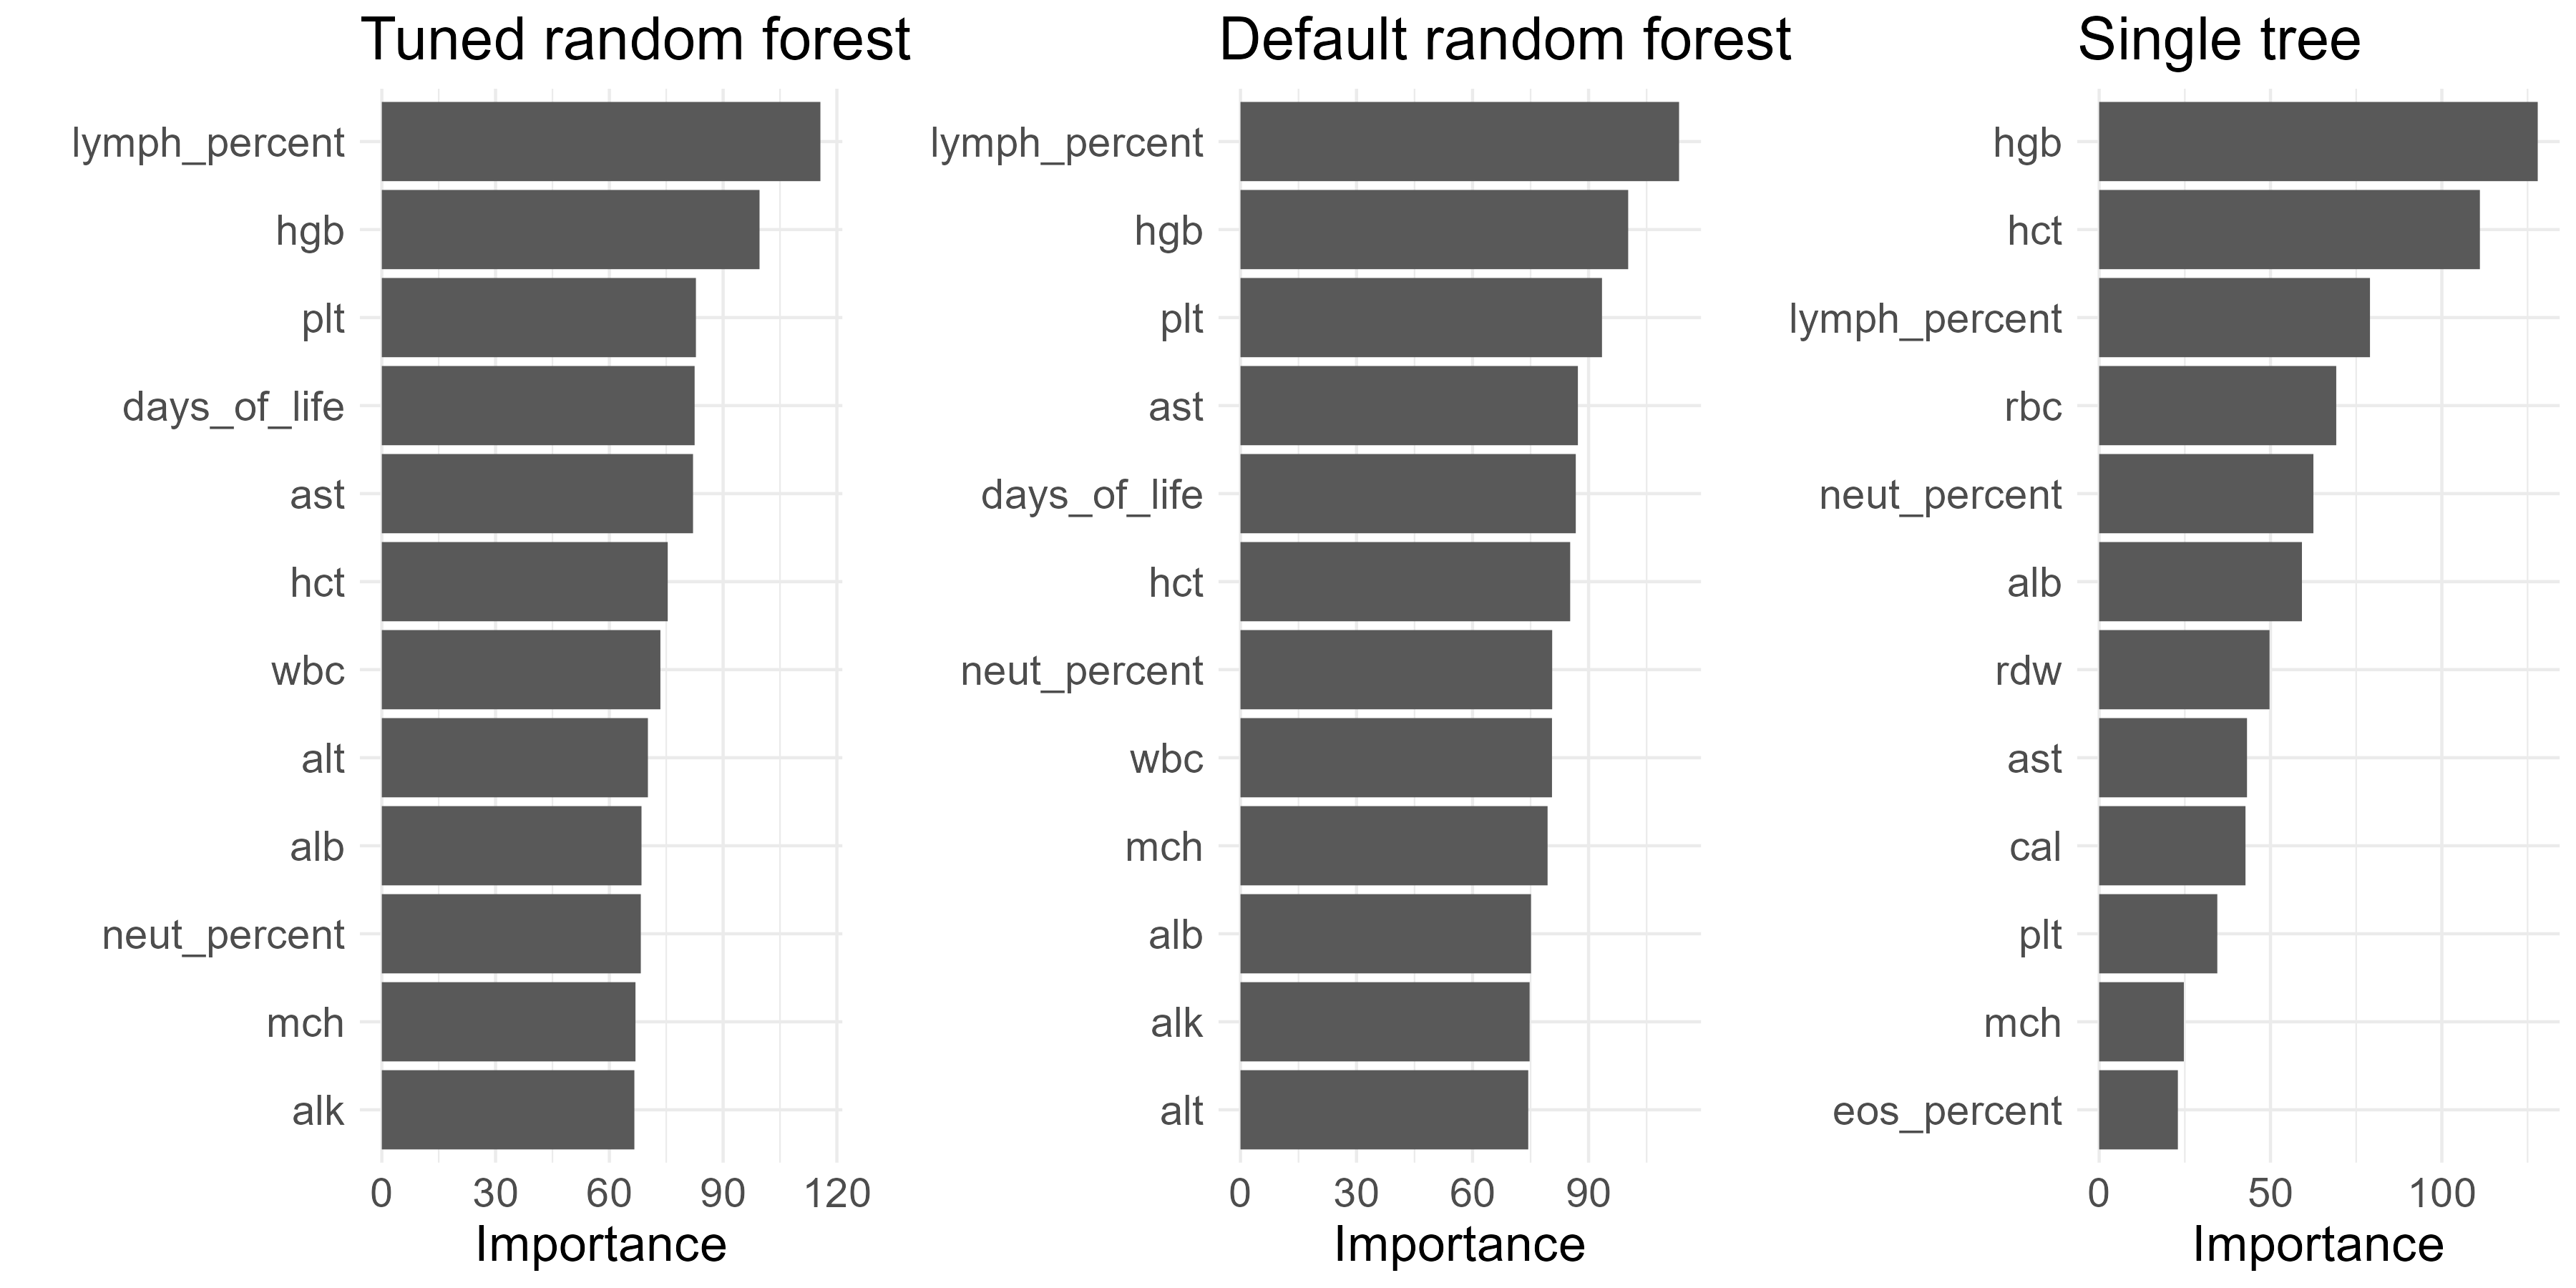
Here the importance of the predictors are presented. The feature with the highest importance in the random forest is lymph_percent.
Adaboost
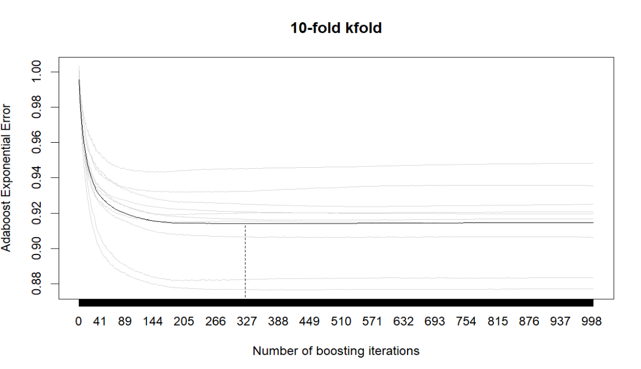
Adaptive boosting, known as adaboost, is also an ensemble learning method that combines multiple weak learners sequentially to adjust the weights of training instances based on their classification accuracy. Adaboost is usually applied in binary classification, where misclassified instances are given higher weights. These weak models are generated sequentially to ensurethat the mistakes of previous models are learned by their successors.
With a step size of 0.1, my optimal number of boosting iterations are 323, remainining 19 predictors in the generalized linear model. This number indicates the best balance between model performance (error) and computational efficiency.
Models Comparison
The specificity, sensitivity, Positive Predictive Value (PPV), Negative Predictive Value (NPV) of the tuned random forest model are all higher than the Logistic, LASSO, and Adaboost in the validation set, i.e. 20% of the data that is not used for training. The Kappa of 48% as of random forest means a fair agreement.
| Leaner | Accuracy | Kappa | Sensitivity | Specificity | PPV | NPV |
|---|---|---|---|---|---|---|
| Logistic Regression | 69.27% | 37.67% | 78.11% | 59.20% | 68.57% | 70.35% |
| Lasso | 68.77% | 36.43% | 80.33% | 55.60% | 67.34% | 71.27% |
| Random forest | 74.41% | 48.33% | 79.59% | 68.50% | 74.22% | 74.65% |
| Adaboost | 68.97% | 36.91% | 79.59% | 56.87% | 67.77% | 70.98% |
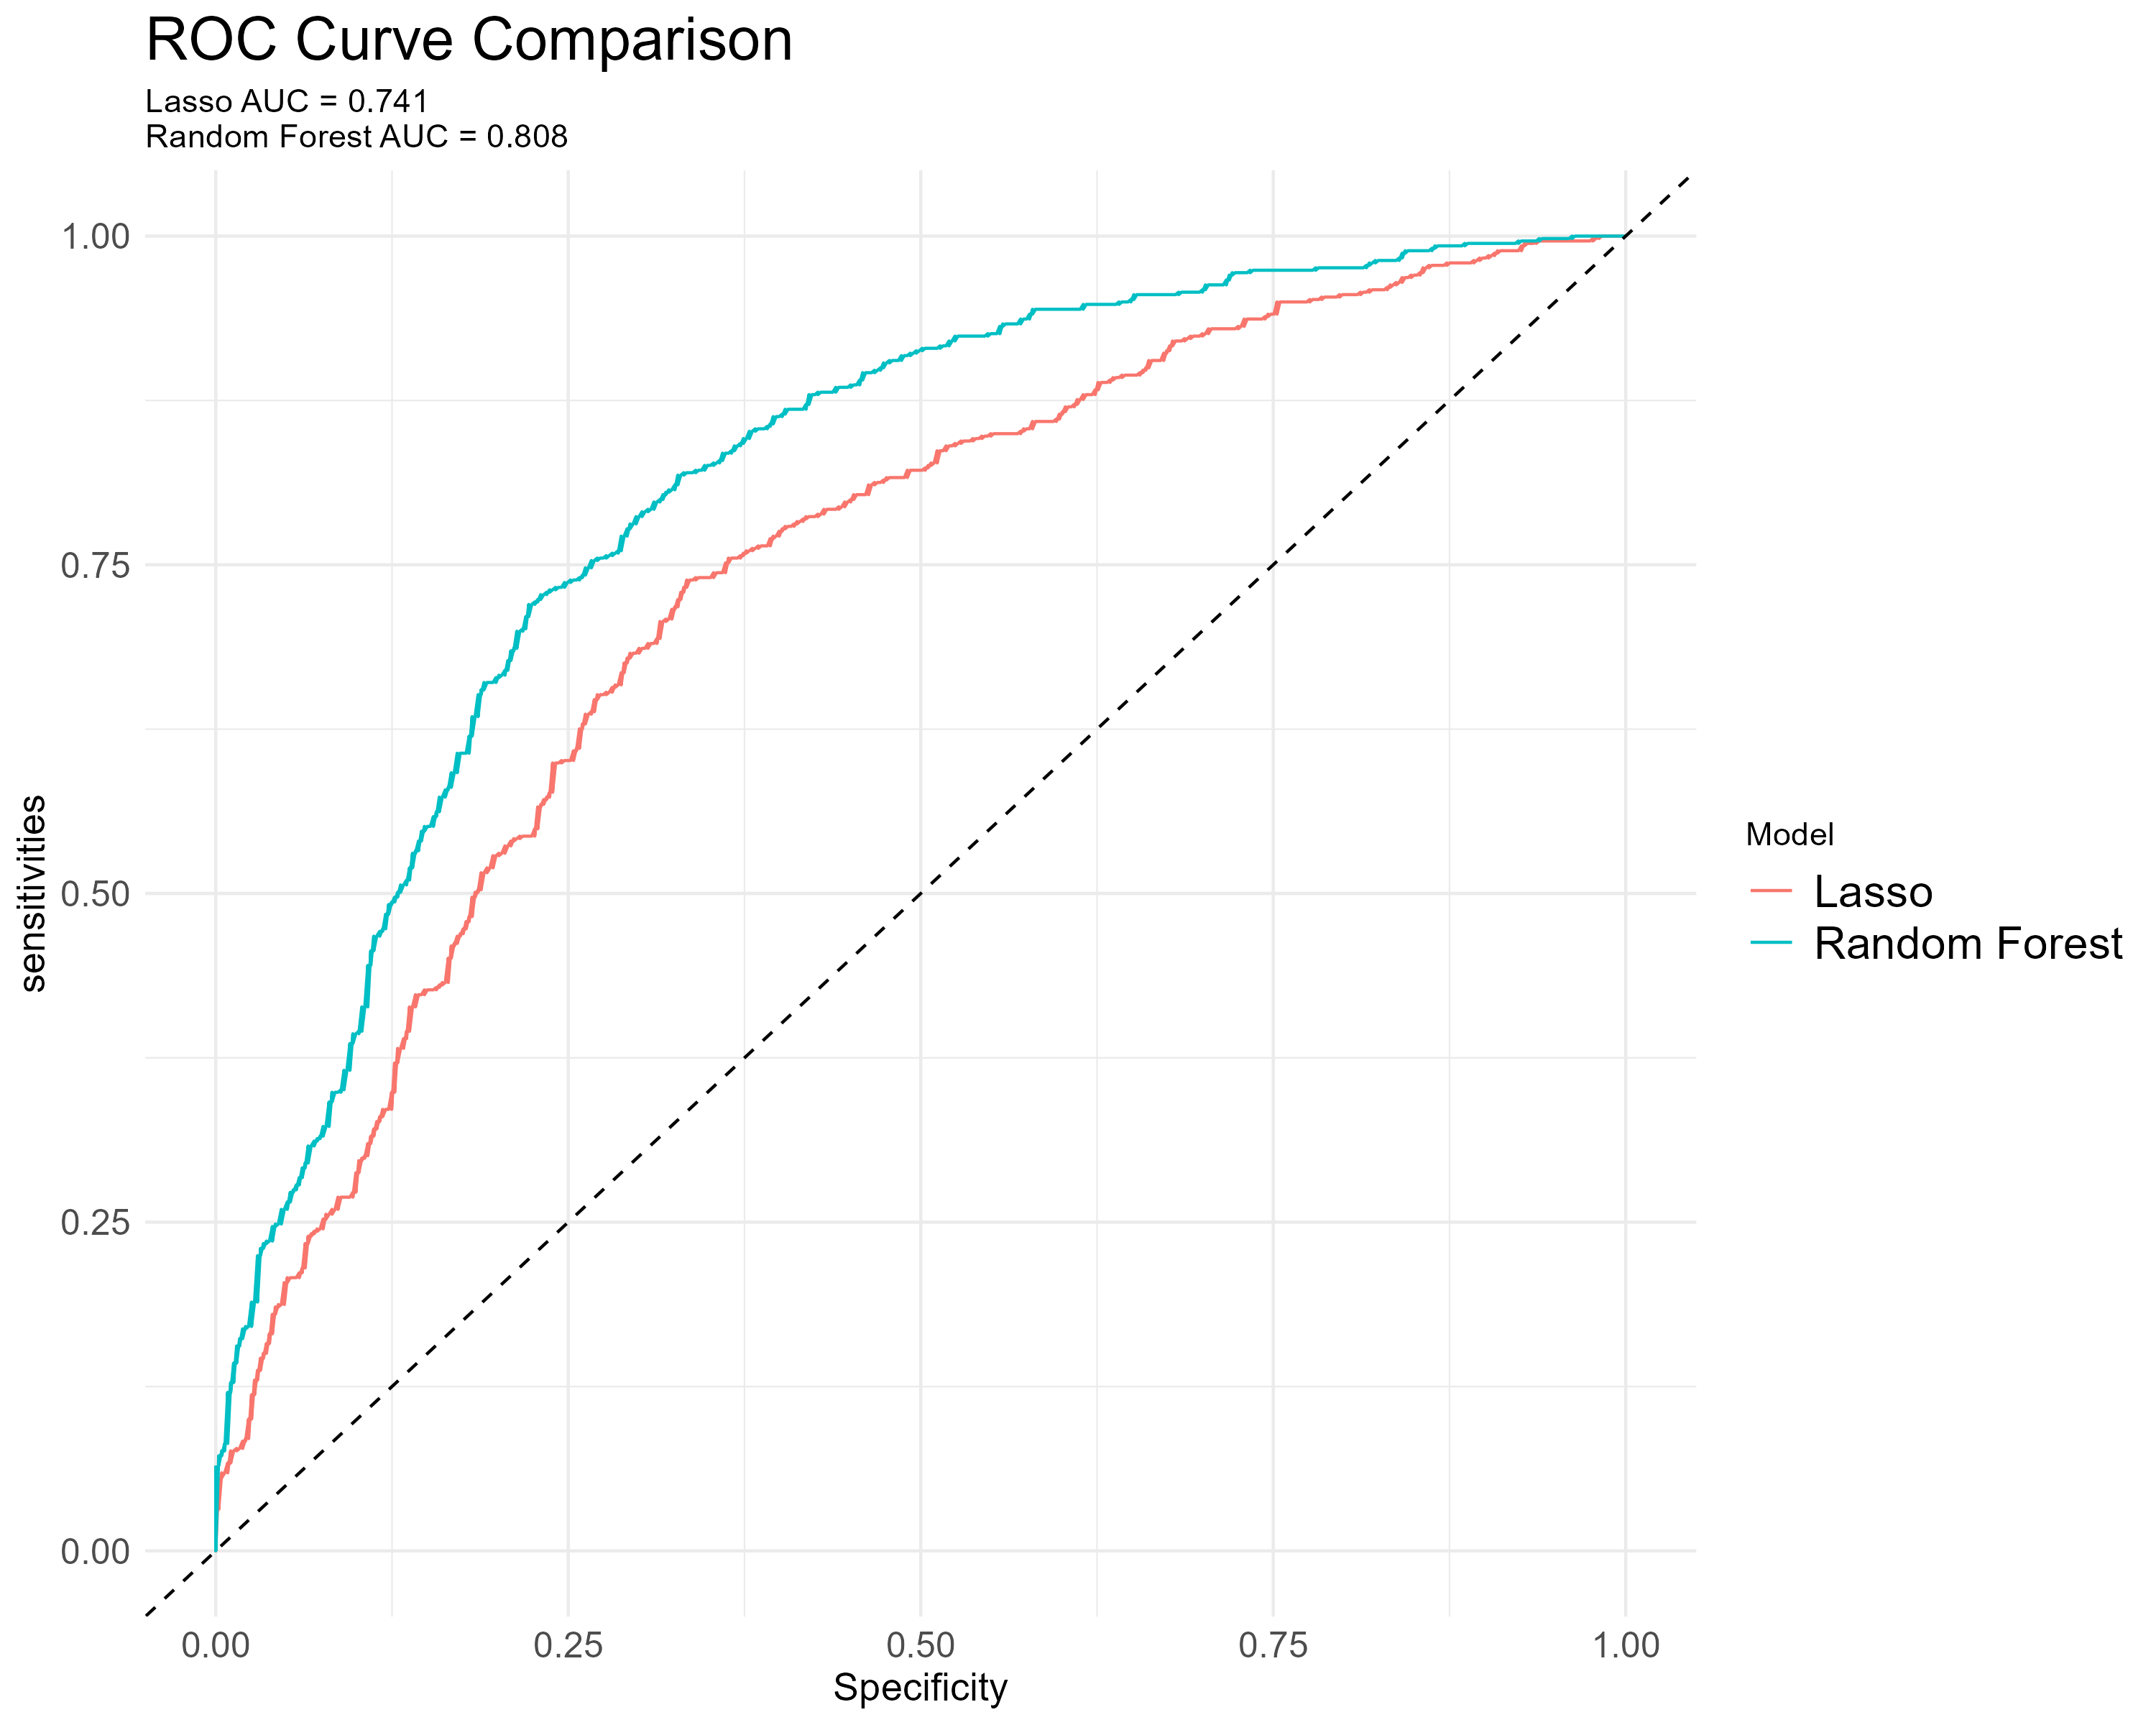
We particularly investigate the area underneath the ROC (AUC) of Lasso and random forest. For random forest, the AUC of 0.808 suggests a reasonable ability to discriminate between the remission status, better than Lasso’s AUC of 0.741. Moreover, there are statistical difference (Z = 6.6253, P < 0.05).
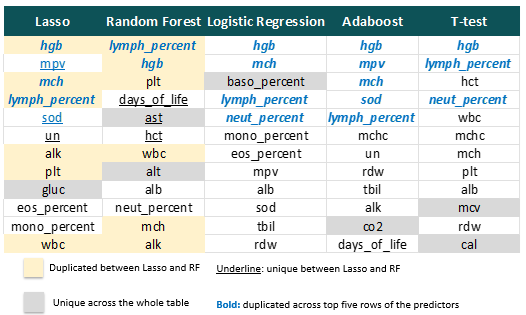
Finally, let’s dive into the importance of the predictors. There are 6 common predictors selected by Lasso and Random forest. Hbg, mch, lympch_percent are the most impactful among five methods, where mch hgb and lymph percent had large normalised differences in the previous T-test analysis. In the figure below, the underlined predictors that are unique to either Lasso or random forest exhibit a distinct pattern in the previous correlation pairs.This is a characteristic of Lasso penalty: it will typically pick only one of a group of correlated predictor variables to explain the variation in the outcome.
Conclusion
Random forest (74.41%) has better accuracy on the prediction for the validation data, surpassing logistic regression, Lasso, adn Adaboost. Besides, regarding AUC, random forest (0.741) has a good ability to discriminate between the remission and active disease.
In terms of predictor importance, among the 12 predictors selected by Lasso learner, 6 of them are also selected in the top 12 predictors identified by the random forest, indicating their importance. Therefore, through using these important predictors, fitting a tuned random forest model on their biomarkers can support the predicting of remission status.
In collaboration with ChatGPT, this article has been adapted from the assessment of the Machine Learning module at LSHTM, with thanks to lecturers Pierre Masselot, Alex Lewin, and Sudhir Venkatesan.